
Agent connectivity: SIP/WS and connection errors
1. Description
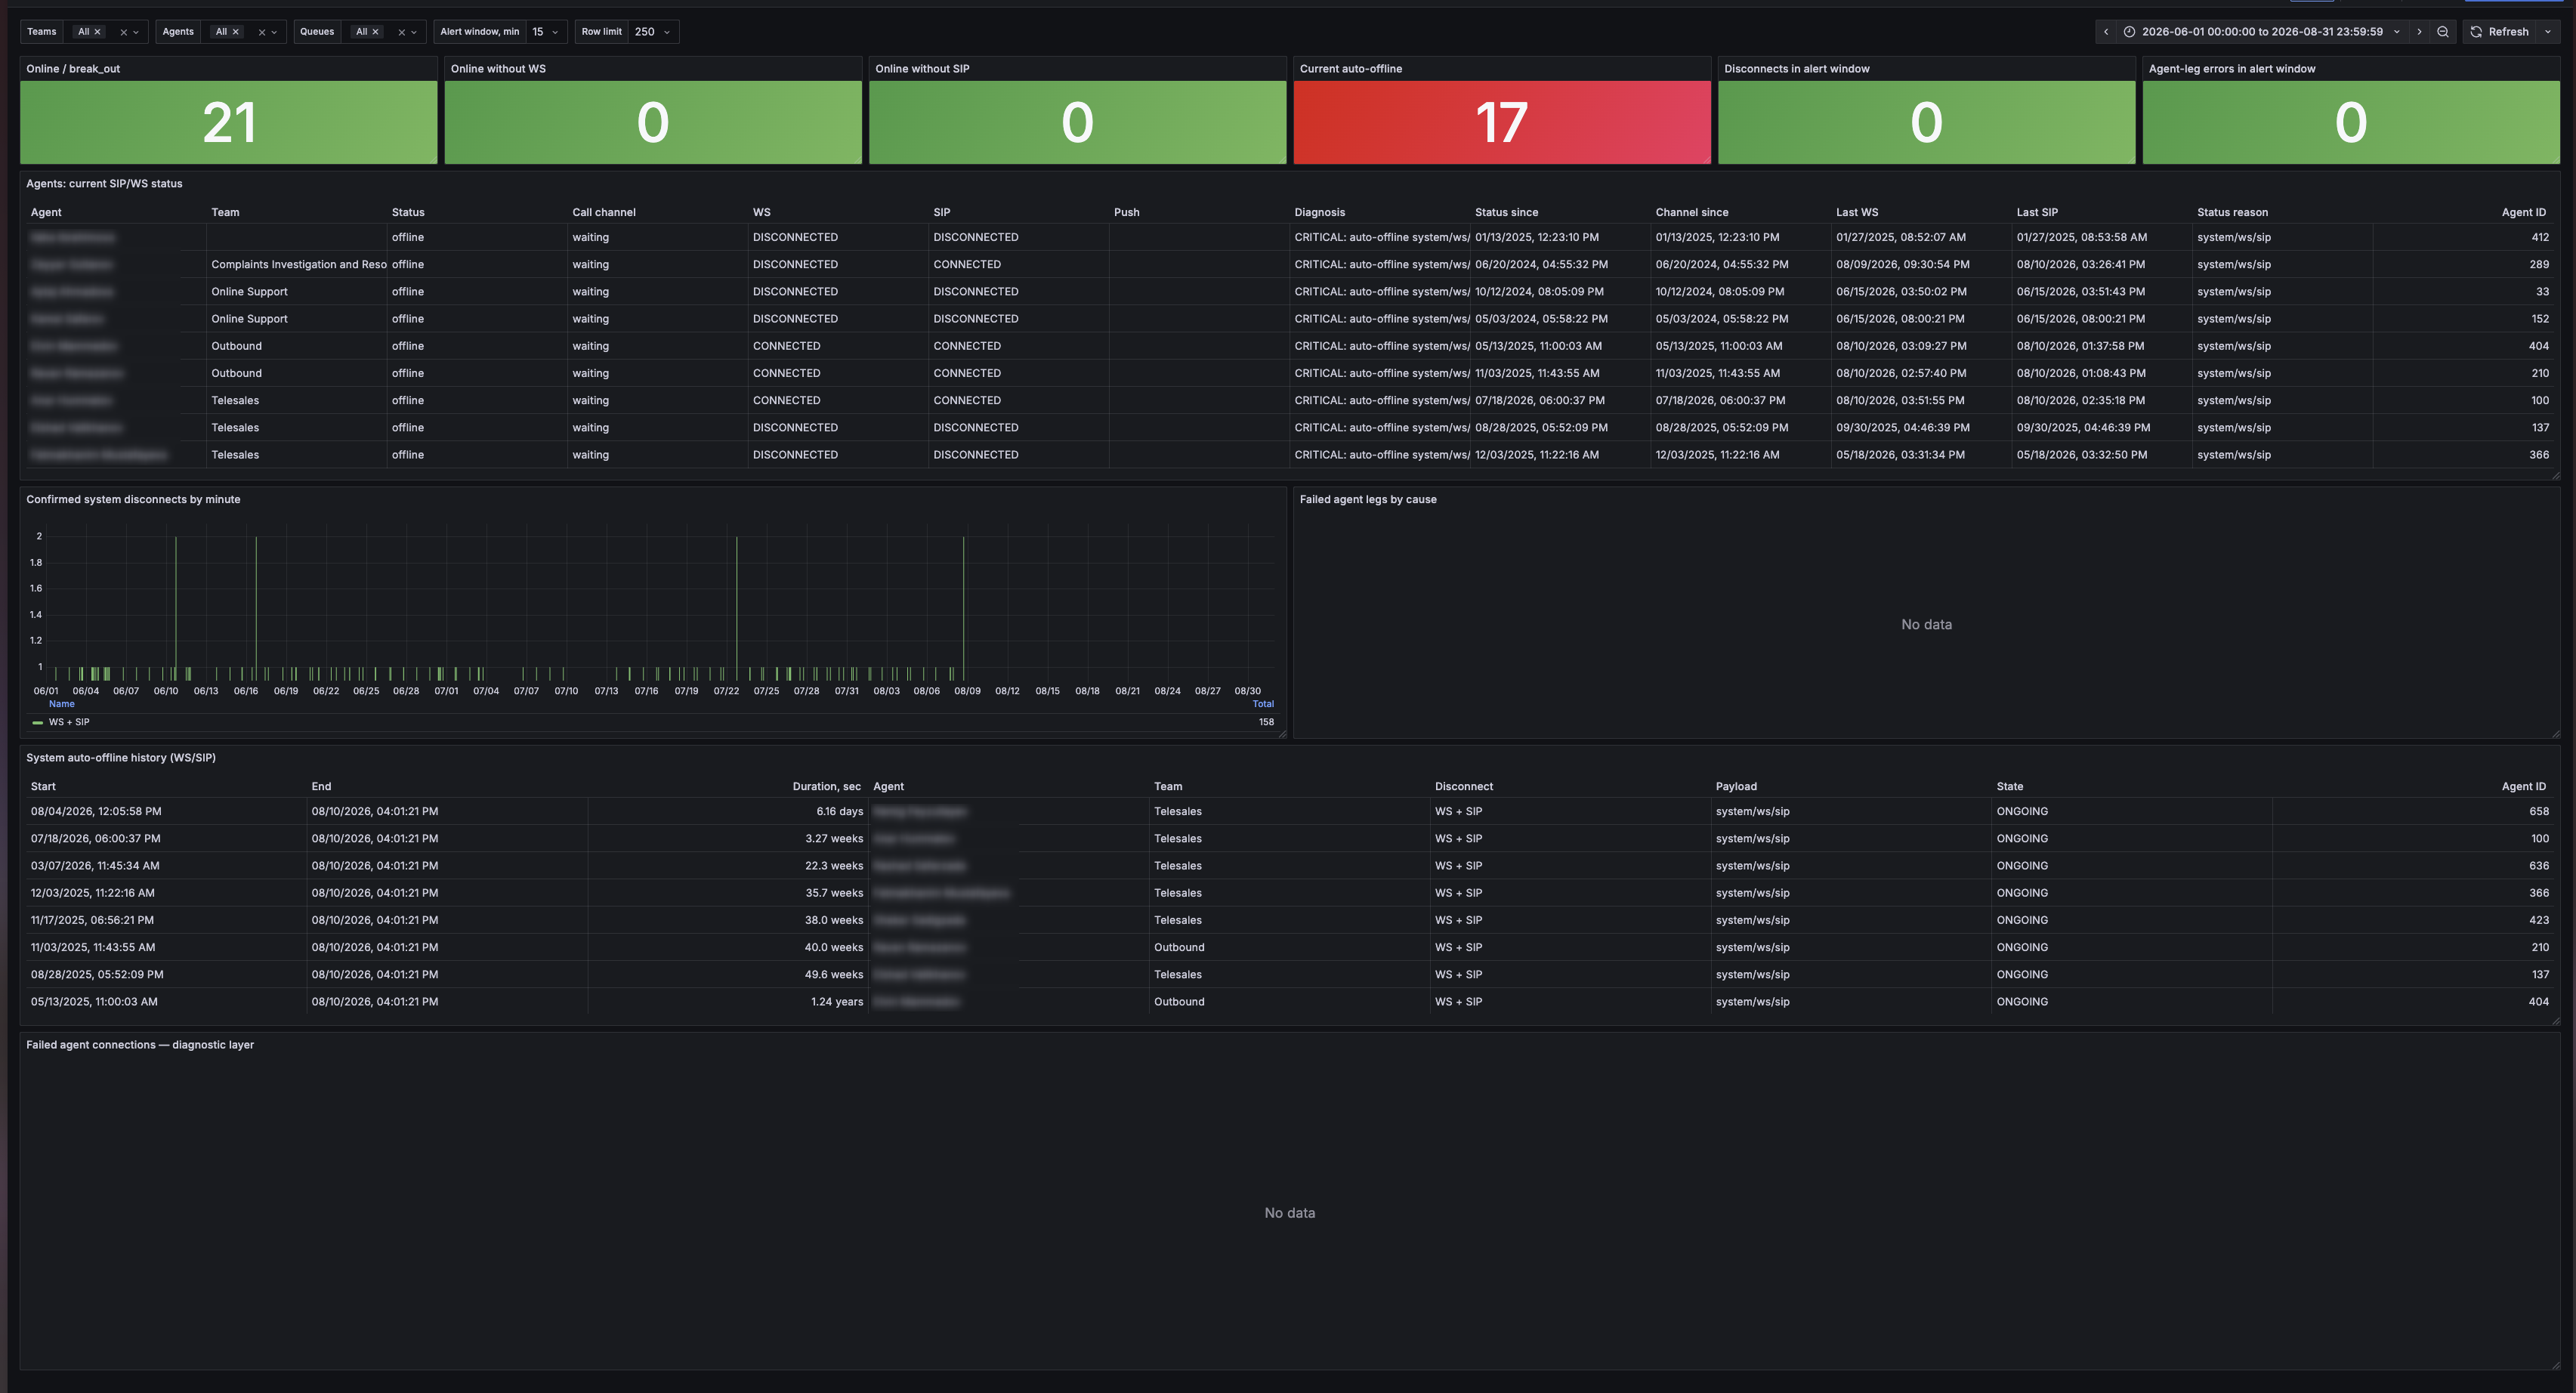
A dashboard for network diagnostics of agent connectivity. It shows whether an agent is really reachable (SIP registration, WebSocket), whether the system moved them to offline because the connection was lost, and which attempts to connect a call to them failed. Answers the question "the agent is online, but calls and chats are not routed to them — why".
Refreshes automatically every 10 seconds.
Consists of:
-
Filters: the "Teams", "Agents", "Queues", "Alert window, min" and "Row limit" drop-down lists;
-
Current state stat block (6 stats);
-
The "Agents: current SIP/WS status" table;
-
The "Confirmed system disconnects by minute" chart;
-
The "Failed agent legs by cause" chart;
-
The "System auto-offline history (WS/SIP)" table;
-
The "Failed agent connections — diagnostic layer" table.
1.1. Drop-down lists

|
Filter |
Purpose |
|---|---|
|
Teams |
Selects the teams to display data for |
|
Agents |
Selects agents |
|
Queues |
Selects queues. Affects the failed-connection panels |
|
Alert window, min |
The interval used by the "Disconnects in alert window" and "Agent-leg errors in alert window" stats: 5, 15, 30 or 60 minutes. Does not affect any other panel |
|
Row limit |
The maximum number of rows displayed in the dashboard tables |
1.2. Current state stat block

|
Stat |
What it shows |
Colours |
|---|---|---|
|
Online / break_out |
The number of agents in |
Green if at least one agent is found; |
|
Online without WS |
Of the |
|
|
Online without SIP |
Of the |
|
|
Current auto-offline |
How many agents the system is currently keeping offline because WS or SIP is missing (causes |
|
|
Disconnects in alert window |
The number of confirmed auto-offline events within the interval set by the "Alert window, min" filter. Independent of the global Grafana time range |
|
|
Agent-leg errors in alert window |
The number of failed attempts to connect a call to an agent within the same interval. Counts |
|
1.3. The "Agents: current SIP/WS status" table

Consists of the following columns:
|
Column |
What it means |
|---|---|
|
Agent / Agent ID |
The agent's name and internal identifier |
|
Team |
The team the agent belongs to |
|
Status |
The computed status: |
|
Call channel |
The state of the voice channel: |
|
WS |
WebSocket connection state: |
|
SIP |
SIP registration state: |
|
Push |
|
|
Diagnosis |
The overall assessment of the connection: |
|
Status since / Channel since |
The time of the last status change and, separately, of the last call-channel change |
|
Last WS / Last SIP |
The time of the last activity over WebSocket and over SIP |
|
Status reason |
The technical payload (for example, |
Rows are sorted CRITICAL first, then WARNING, then OK; within a group — by team and agent name.
The table shows the current state, so the global Grafana time range ("Today", "Last 6 hours") does not filter it. A past date in the "Last WS" and "Last SIP" columns means there has been no activity over that connection since then — it is not a display error.
1.4. The "Confirmed system disconnects by minute" chart

A bar chart grouped by minute. The WS, SIP and WS + SIP series are stacked on top of each other; the legend below shows the total number of events of each type for the period.
Depends on the global Grafana time range. No data means there were no confirmed system disconnects in the selected period.
1.5. The "Failed agent legs by cause" chart
A bar chart of failed attempts to connect a call to an agent, grouped by minute and by termination cause. Each cause has its own colour: USER_NOT_REGISTERED, NO_ANSWER, NO_USER_RESPONSE, LOSE_RACE, route/transport causes and others.
Depends on the global Grafana time range and on the "Queues" filter. No data means there were no failed attempts in the selected period.
1.6. The "System auto-offline history (WS/SIP)" table

The history of confirmed system disconnects, one row per episode. Depends on the global Grafana time range.
Consists of the following columns:
|
Column |
What it means |
|---|---|
|
Start / End |
The time the episode started and ended |
|
Duration, sec |
The length of the episode. For |
|
Agent / Agent ID |
The agent the episode concerns |
|
Team |
The agent's team |
|
Disconnect |
What exactly dropped: |
|
Payload |
The technical cause tag |
|
State |
|
1.7. The "Failed agent connections — diagnostic layer" table
A detailed list of failed attempts to connect a call to an agent (agent leg), one row per attempt. This is the section to open once the "Agent-leg errors in alert window" stat has been triggered.
Depends on the global Grafana time range and on the "Queues" filter. No data means there were no such attempts for the selected period and queue.
Consists of the following columns:
|
Column |
What it means |
|---|---|
|
Time / Agent / Team / Queue |
When the attempt was made, to whom, and from which queue |
|
Cause |
The agent leg termination cause code |
|
SIP code |
The SIP response code |
|
Attempt ID / Agent Call ID |
The identifiers of the distribution attempt and of the call on the agent's side |
|
Diagnostics |
The interpretation of the cause (see below) |
Values of the "Diagnostics" column:
|
Value |
What it means |
|---|---|
|
|
The agent's SIP was not registered at the time of the attempt |
|
|
A probable routing or transport problem |
|
|
The agent's device did not respond |
|
|
An indirect sign that does not in itself prove a network fault. This is where |
|
|
Another cause |
Only the CONFIRMED value unambiguously confirms a problem with the agent's connection. The rest require verification.