
1. Description
The Queues section in the Supervisor application is designed for monitoring the status of queues handled by agents under the supervision of a supervisor. It allows real-time tracking of each queue's current state, including the number of calls, status, type, and workload.
2. Main Interface Functionality
The "Queues" page consists of the following blocks:
-
Search field (Fig. 1.(1));
-
Data export tool (Fig. 1.(2));
-
Filtering panel (Fig. 1.(3));
-
Record table (Fig. 1.(4));
-
Pagination (Fig. 1.(5)).
.png?cb=21431146a6718d01239ead0990c68169)
3. Viewing Statistics in the Record Table
The central part of the Queues page displays a table with data on queues linked to the user.
Information is updated automatically every 10 seconds and covers the current day — from 00:00 to 23:59.
The record table consists of three main components (see Fig. 2):
-
Column selection tool (Fig. 2.(1));
-
Manual refresh tool (Fig. 2.(2));
-
Queue metrics table (Fig. 2.(3)).
.png?cb=afac309326da1baf0bf42003812256a0)
3.1. Table Content
The table contains the following columns:
-
Checkboxes — allow selecting one or more queues for further actions.
-
Queue — the name of the queue.
-
Agents — the number of agents in the queue, with status breakdown:
-
total number;
-

-

-

-
-
Team — the team assigned to the queue.
-
In Progress / Waiting — the number of active calls and members waiting for an answer.
-
Activities — completed calls within this queue.
-
Connected / Transferred / Missed — percentage of successful, transferred, and missed calls.
-
Talk Time — total time agents spent speaking with clients.
-
Wrap-up — time agents spent after the end of a call (wrap-up time).
-
ASA (Average Speed of Answer) — the average time it takes for an agent to answer a call.
Formula:
Average Speed of Answer = Total Waiting Time of All Answered Calls During the Day (sec) / Number of Answered Members During the Day (people)
-
AWT (Average Waiting Time) — the average waiting time for a member.
-
AHT (Average Handling Time) — the average duration of call handling (talk + hold + wrap-up).
AHT Formula:
AHT = (Total Talk Time + Total Hold Time + Total Wrap-up Time) / Number of Calls Handled
Where:
-
Total Talk Time — total talk time during the selected period;
-
Total Hold Time — total hold time during the selected period;
-
Total Wrap-up Time — total post-call processing time during the selected period (also referred to as after-call work time);
-
Number of Calls Handled — total number of handled calls during the selected period.
-
SL/20 — percentage of calls answered in less than 20 seconds.
-
SL/30 — percentage of calls answered in less than 30 seconds.
3.2. How to Change the Column Set in the Table
-
Click the column selection icon

-
A modal window titled "Select columns" will appear (Fig. 4).
.png?cb=22c6ddaa040bb0e89c9b511719ccd120)
-
Check the boxes next to the columns you want to display in the table. Changes are saved automatically.
-
To hide unnecessary columns, simply uncheck the corresponding boxes.
-
If a field is selected (Fig. 4.(1)), the column will be displayed.
-
If a field is not selected (Fig. 4.(2)), the column will be hidden.
-
3.3. How to Refresh the Table Manually
-
Click the refresh icon

-
The data will be reloaded automatically without the need to refresh the page manually.
By default, the table updates every 10 seconds automatically.
3.4. Navigating Table Pages
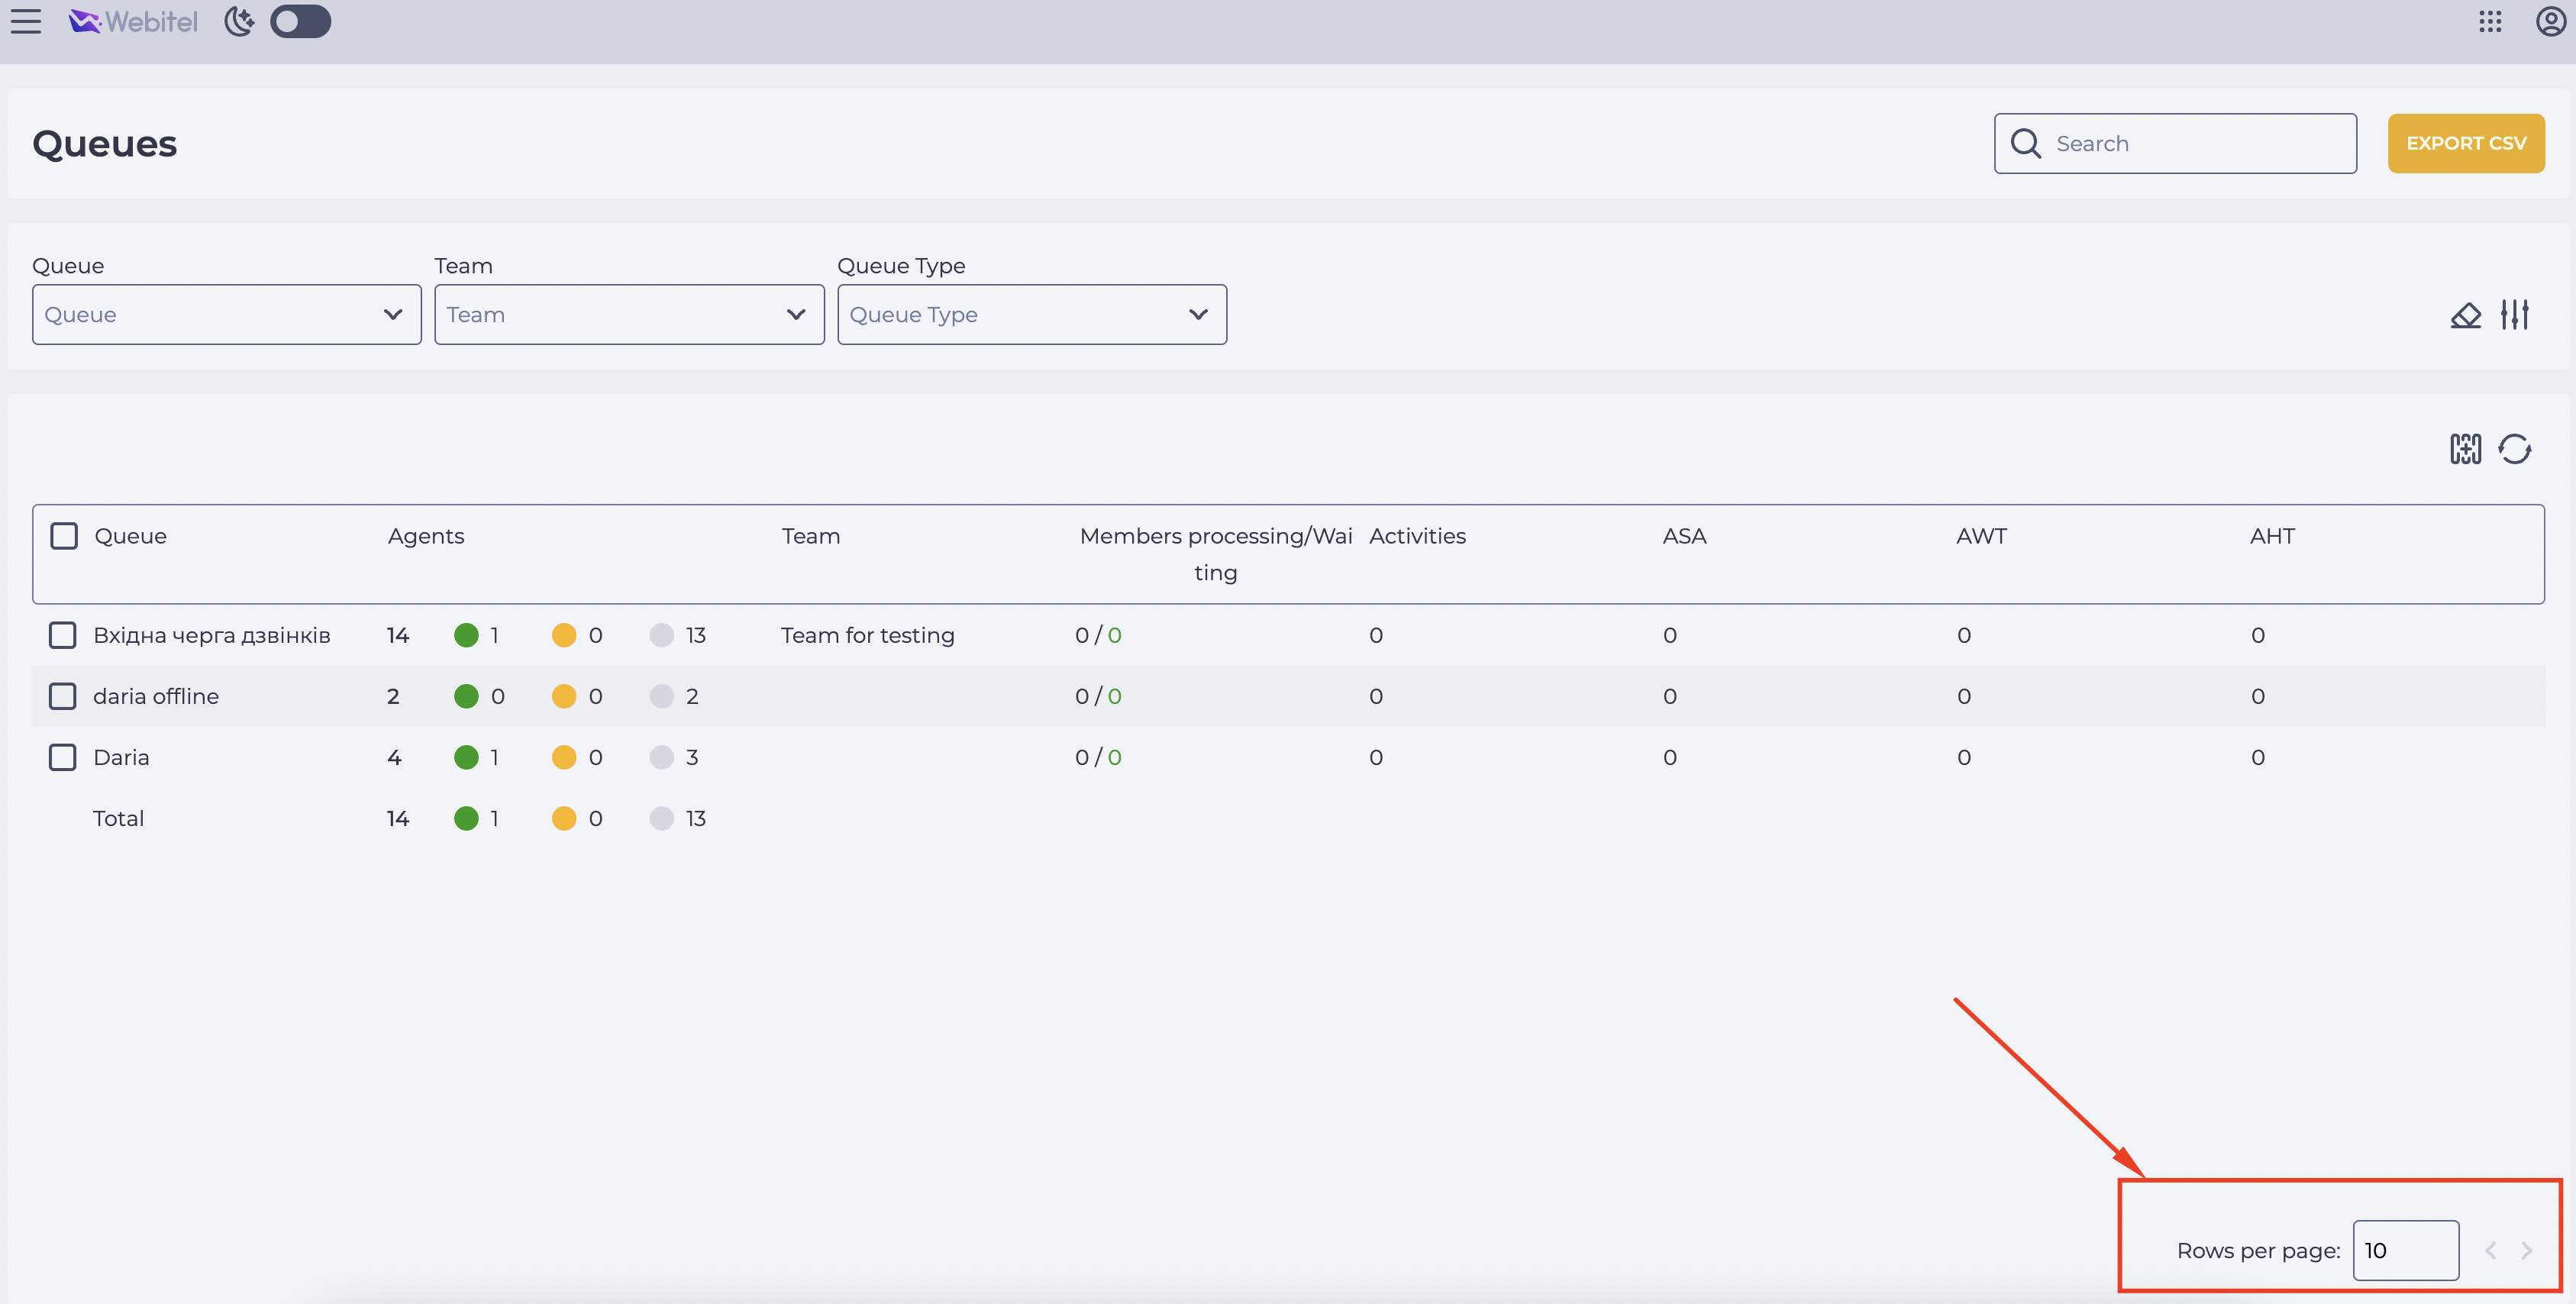
Below the record table, pagination controls are available:
-
Buttons to go to the previous or next page.
-
Dropdown to select the number of rows per page: 10, 25, 50, etc.
3.5. Searching for a Specific Queue
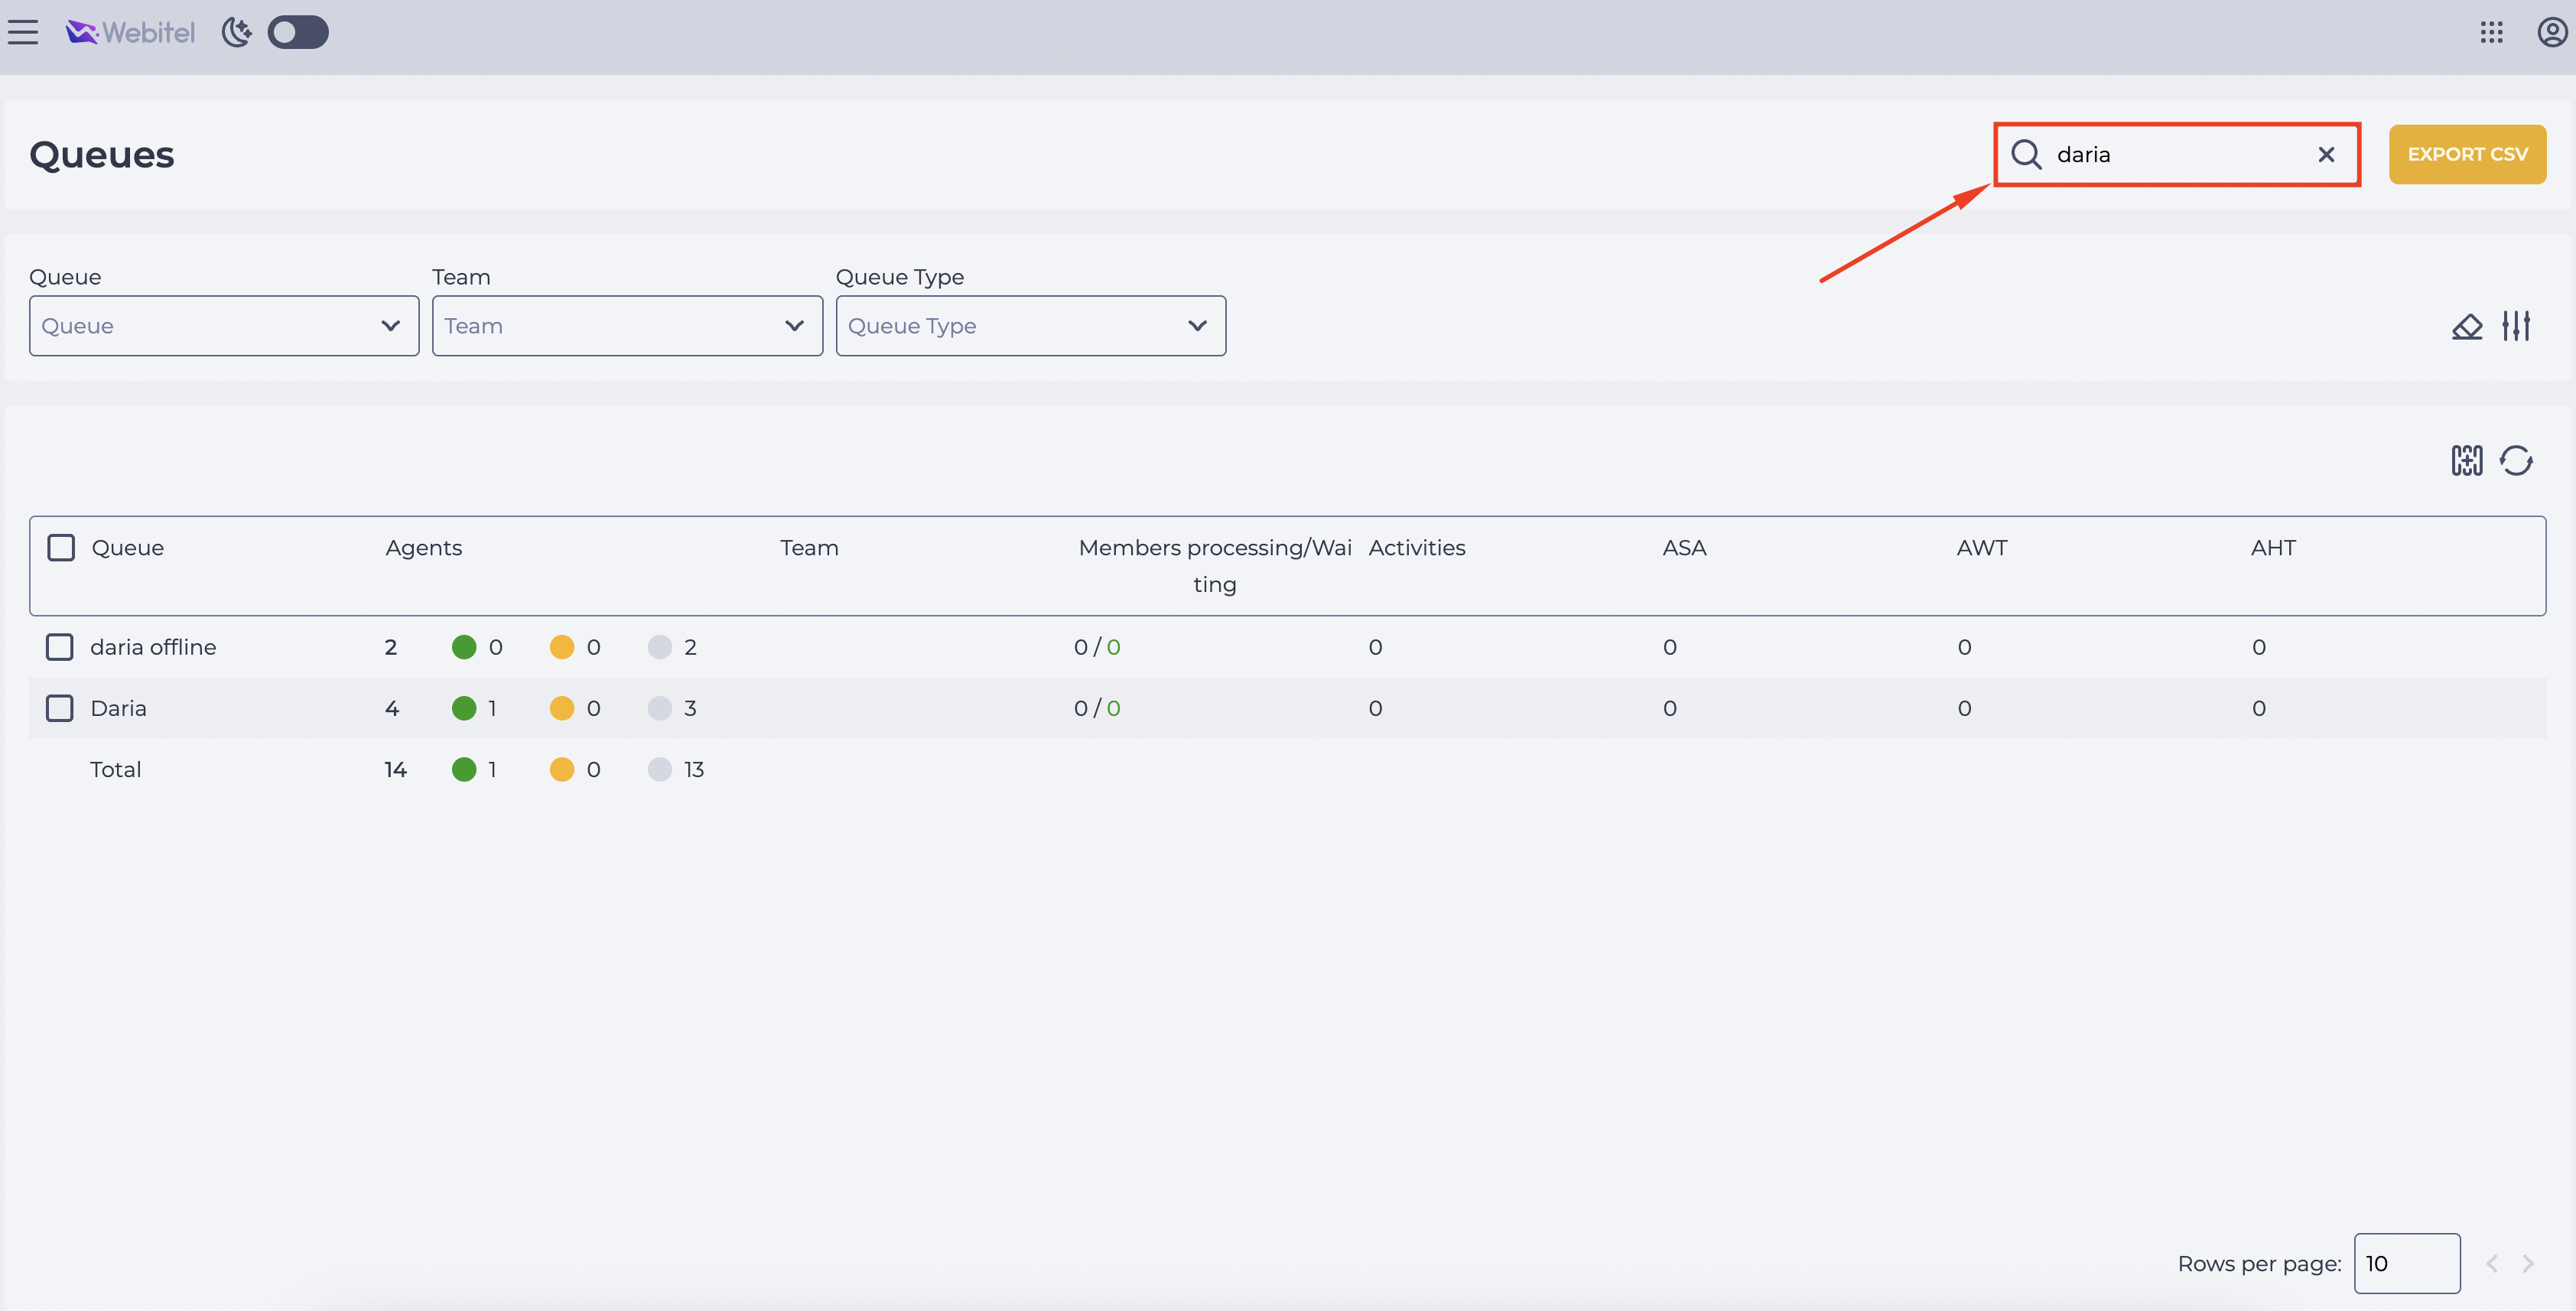
To quickly find a queue by name, use the search field at the top of the page (Fig. 6).
Start typing the name of the queue — the system will instantly display matching results. You can use an asterisk * for partial matches. For example:
-
*sales— shows all queues ending with "sales"; -
inbound*— shows all queues starting with "inbound".
To clear the query and return to the full list, click the icon 
3.6. Exporting the Table with Queue Data
To save the current queue table:
-
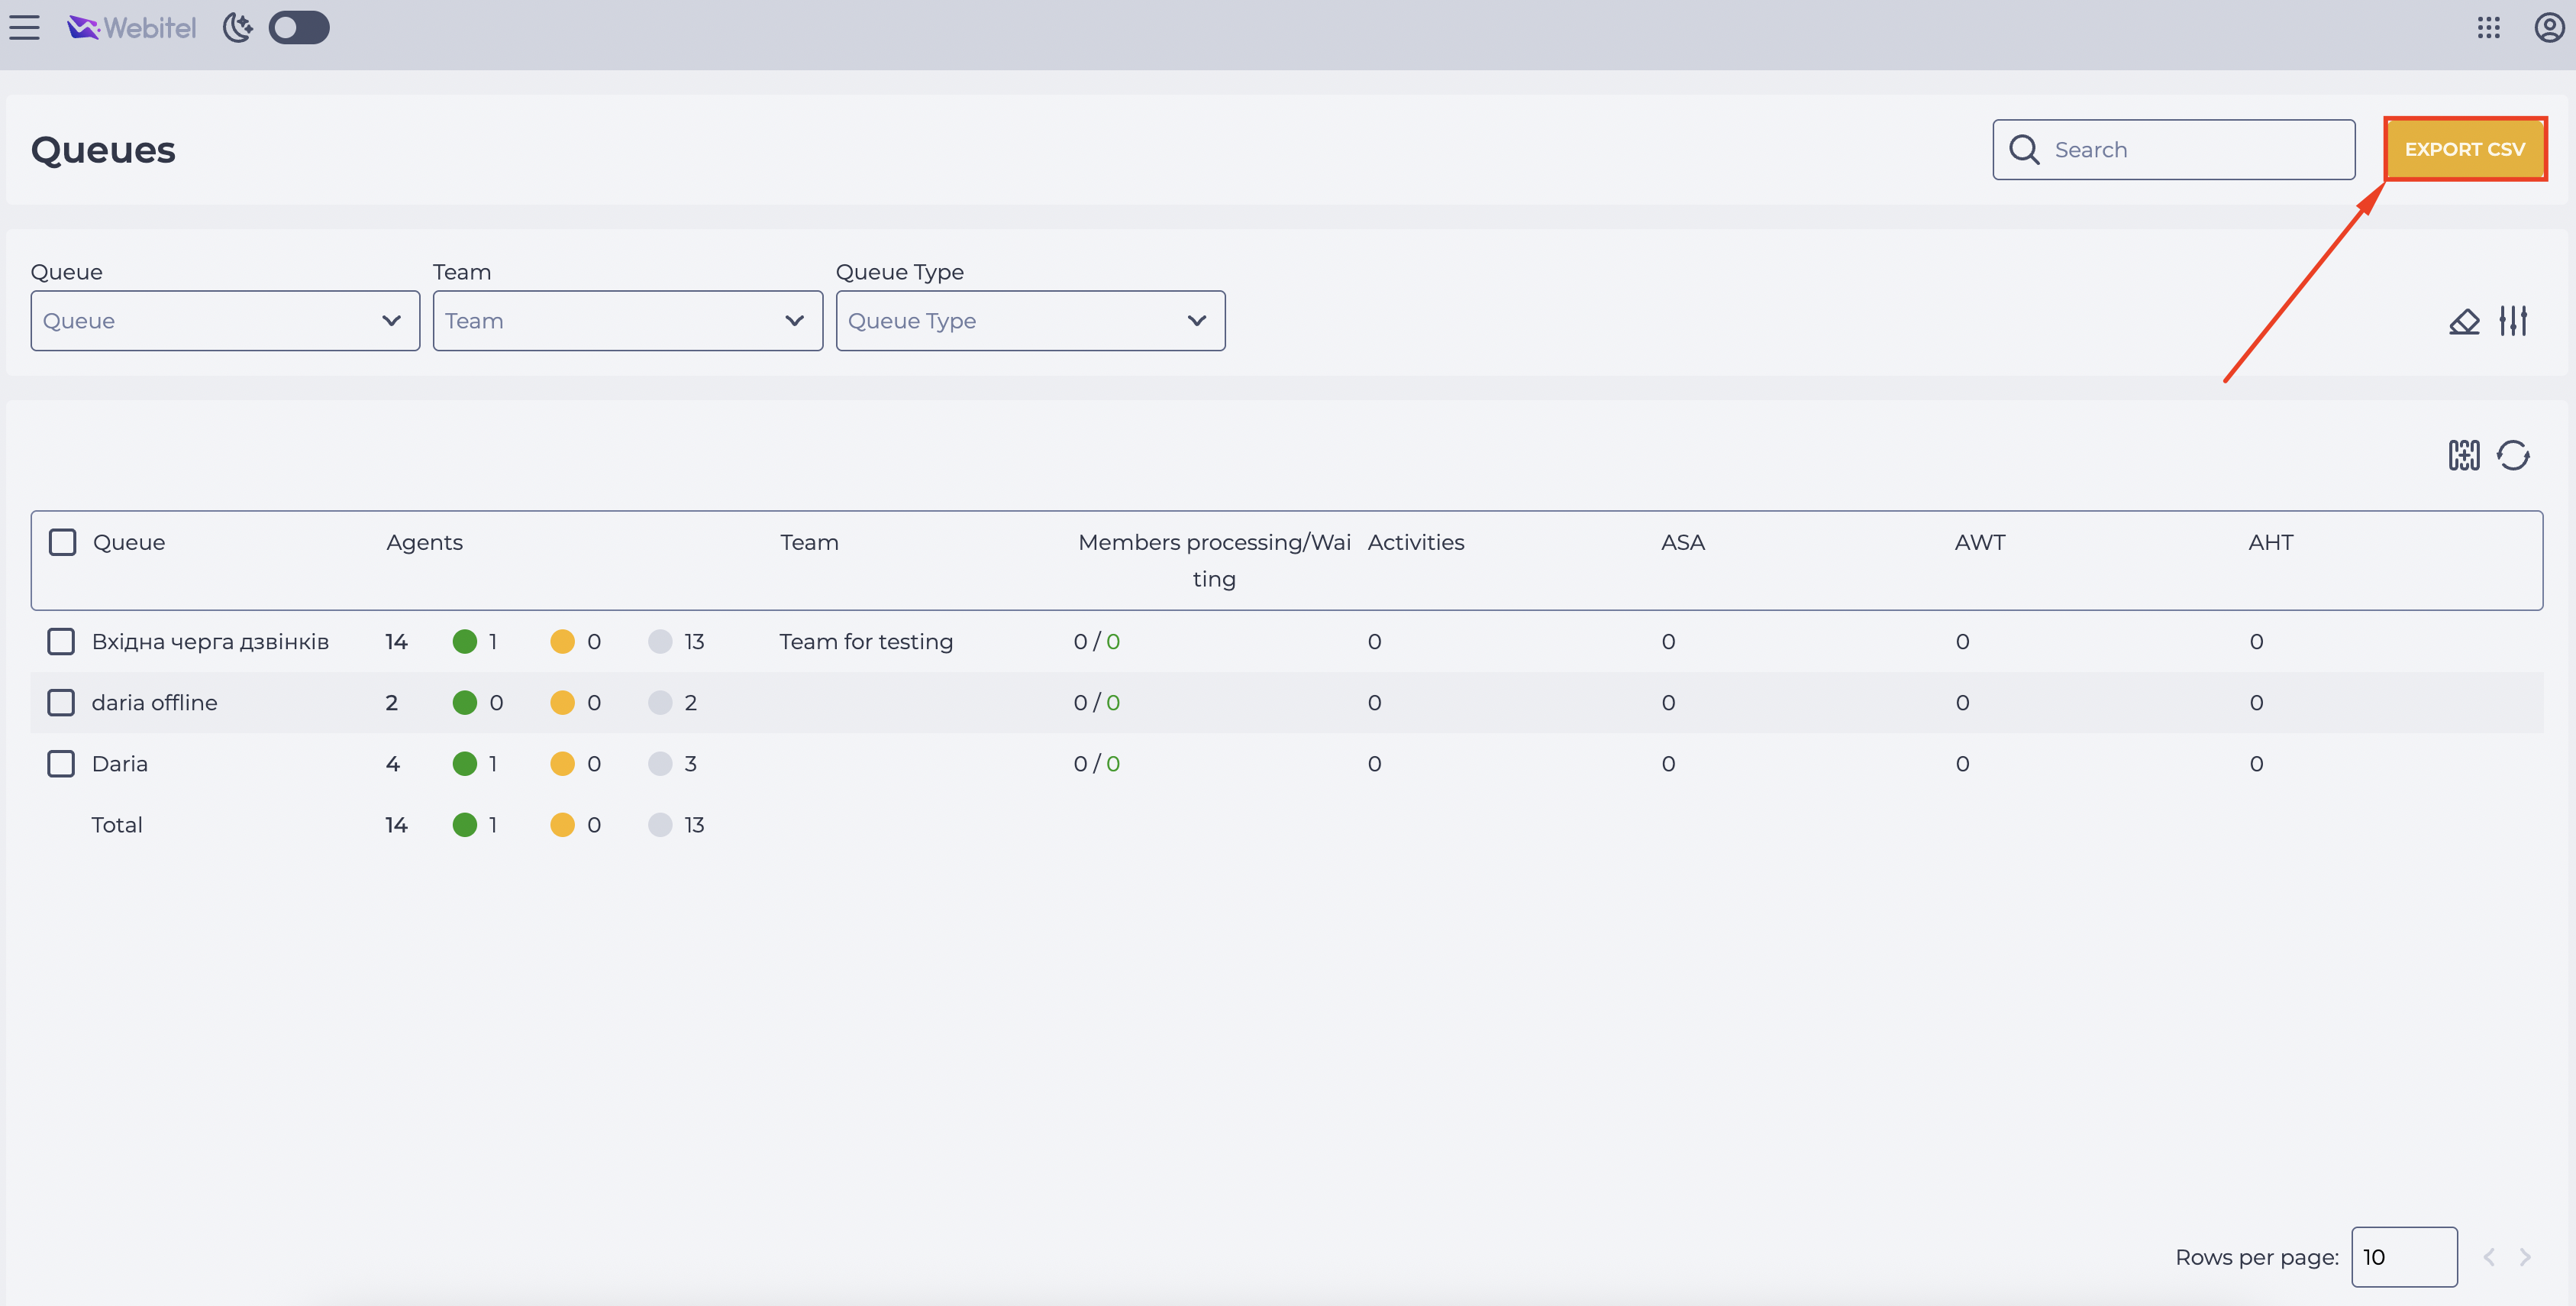
Click the "Export CSV" button in the top right corner (Fig. 7).
-
A file named
queues-stats.csvwill be downloaded automatically.The data in the file will match the content displayed in the table at the time of export (Fig. 8).

3.7. Filtering Queues
The filter panel is located at the top of the "Queues" page. It helps quickly find the necessary queues based on specified parameters.
The panel includes:
-
Filtering fields (Fig. 9.(1));
-
Filter reset tool (Fig. 9.(2));
-
Filter panel expansion tool (Fig. 9.(3)).
.png?cb=dbd651e27d654eb3af34de2a24aaae60)
Basic filtering fields:
-
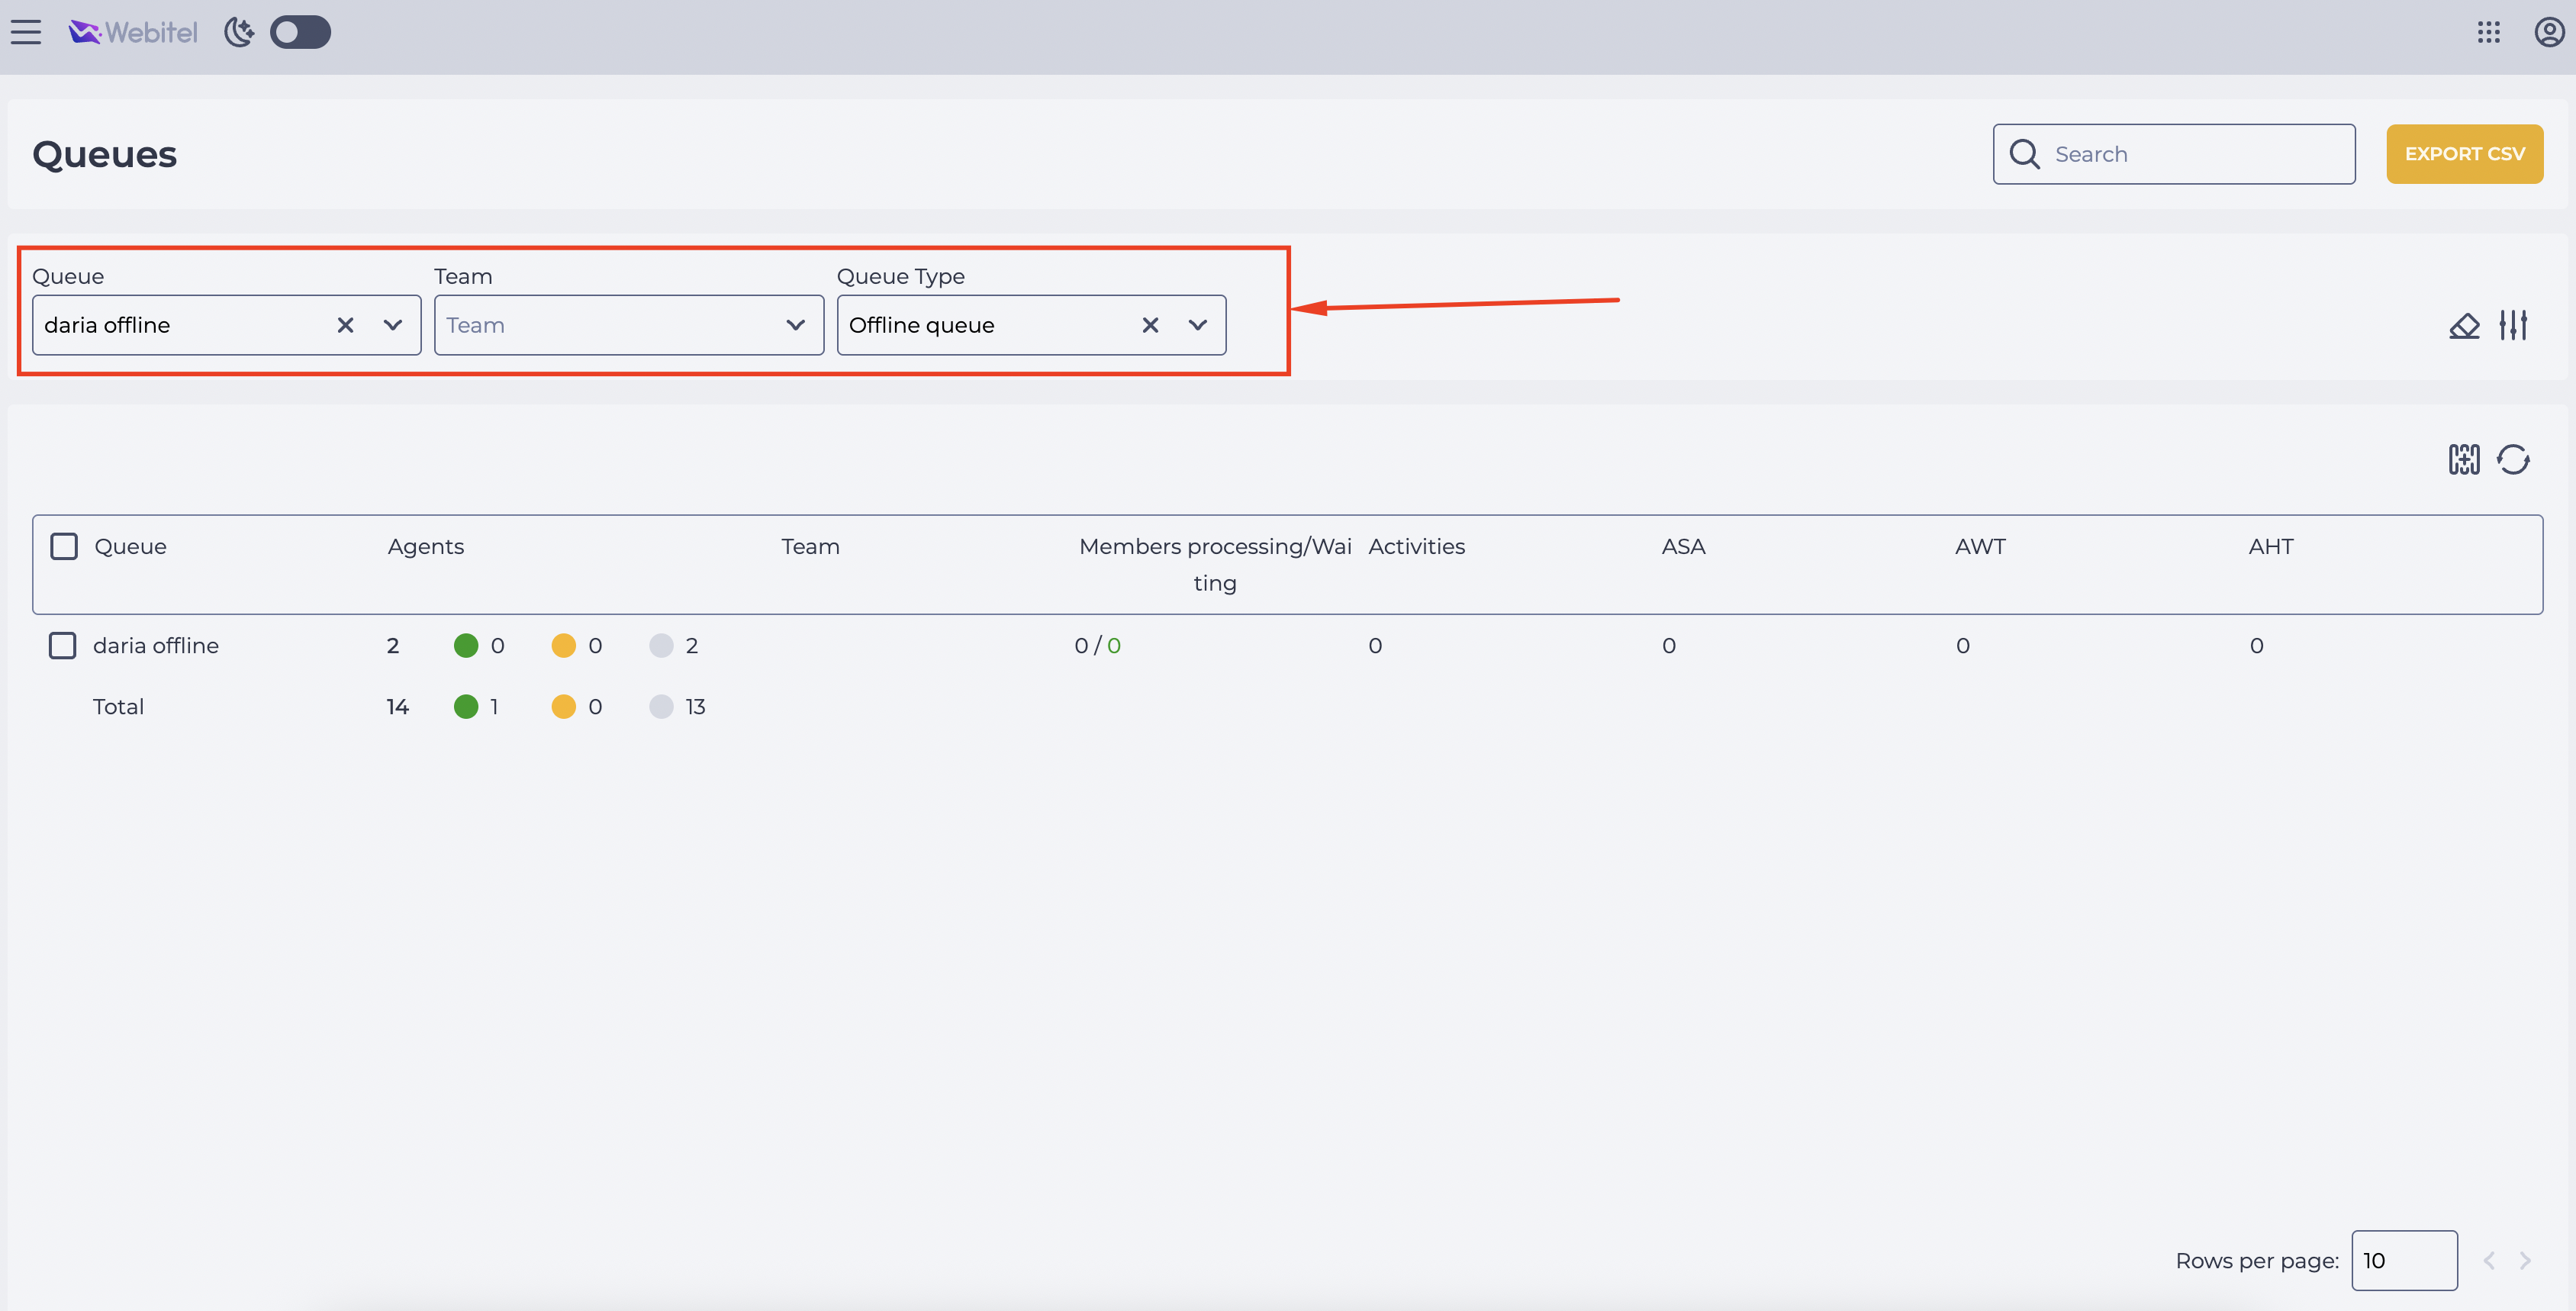
Queue – allows manual selection of one or more specific queues from the list.
-
Team – displays only the queues served by operators of the selected team.
-
Queue Type – allows filtering queues by type. The following types are available:
-
Offline queue;
-
Inbound queue;
-
Outbound IVR;
-
Preview dialing;
-
Progressive dialing;
-
Predictive dialing;
-
Chat queue;
-
Inbound task queue;
-
Outbound task queue.
-
Note: Available values may vary depending on the permissions of the user viewing the page.
To apply a filter:
-
Click the Queue, Team, or Queue Type field.
-
Select the desired value from the list. You can select multiple values (e.g., several queue types).
-
The table will automatically update based on the selected criteria (Fig. 10).
3.7.1. Additional Filter Actions
-
To reset all selected filters — click the icon

-
o expand the filter panel (if some fields are hidden), click the icon

4. How to Check if a Queue is Active
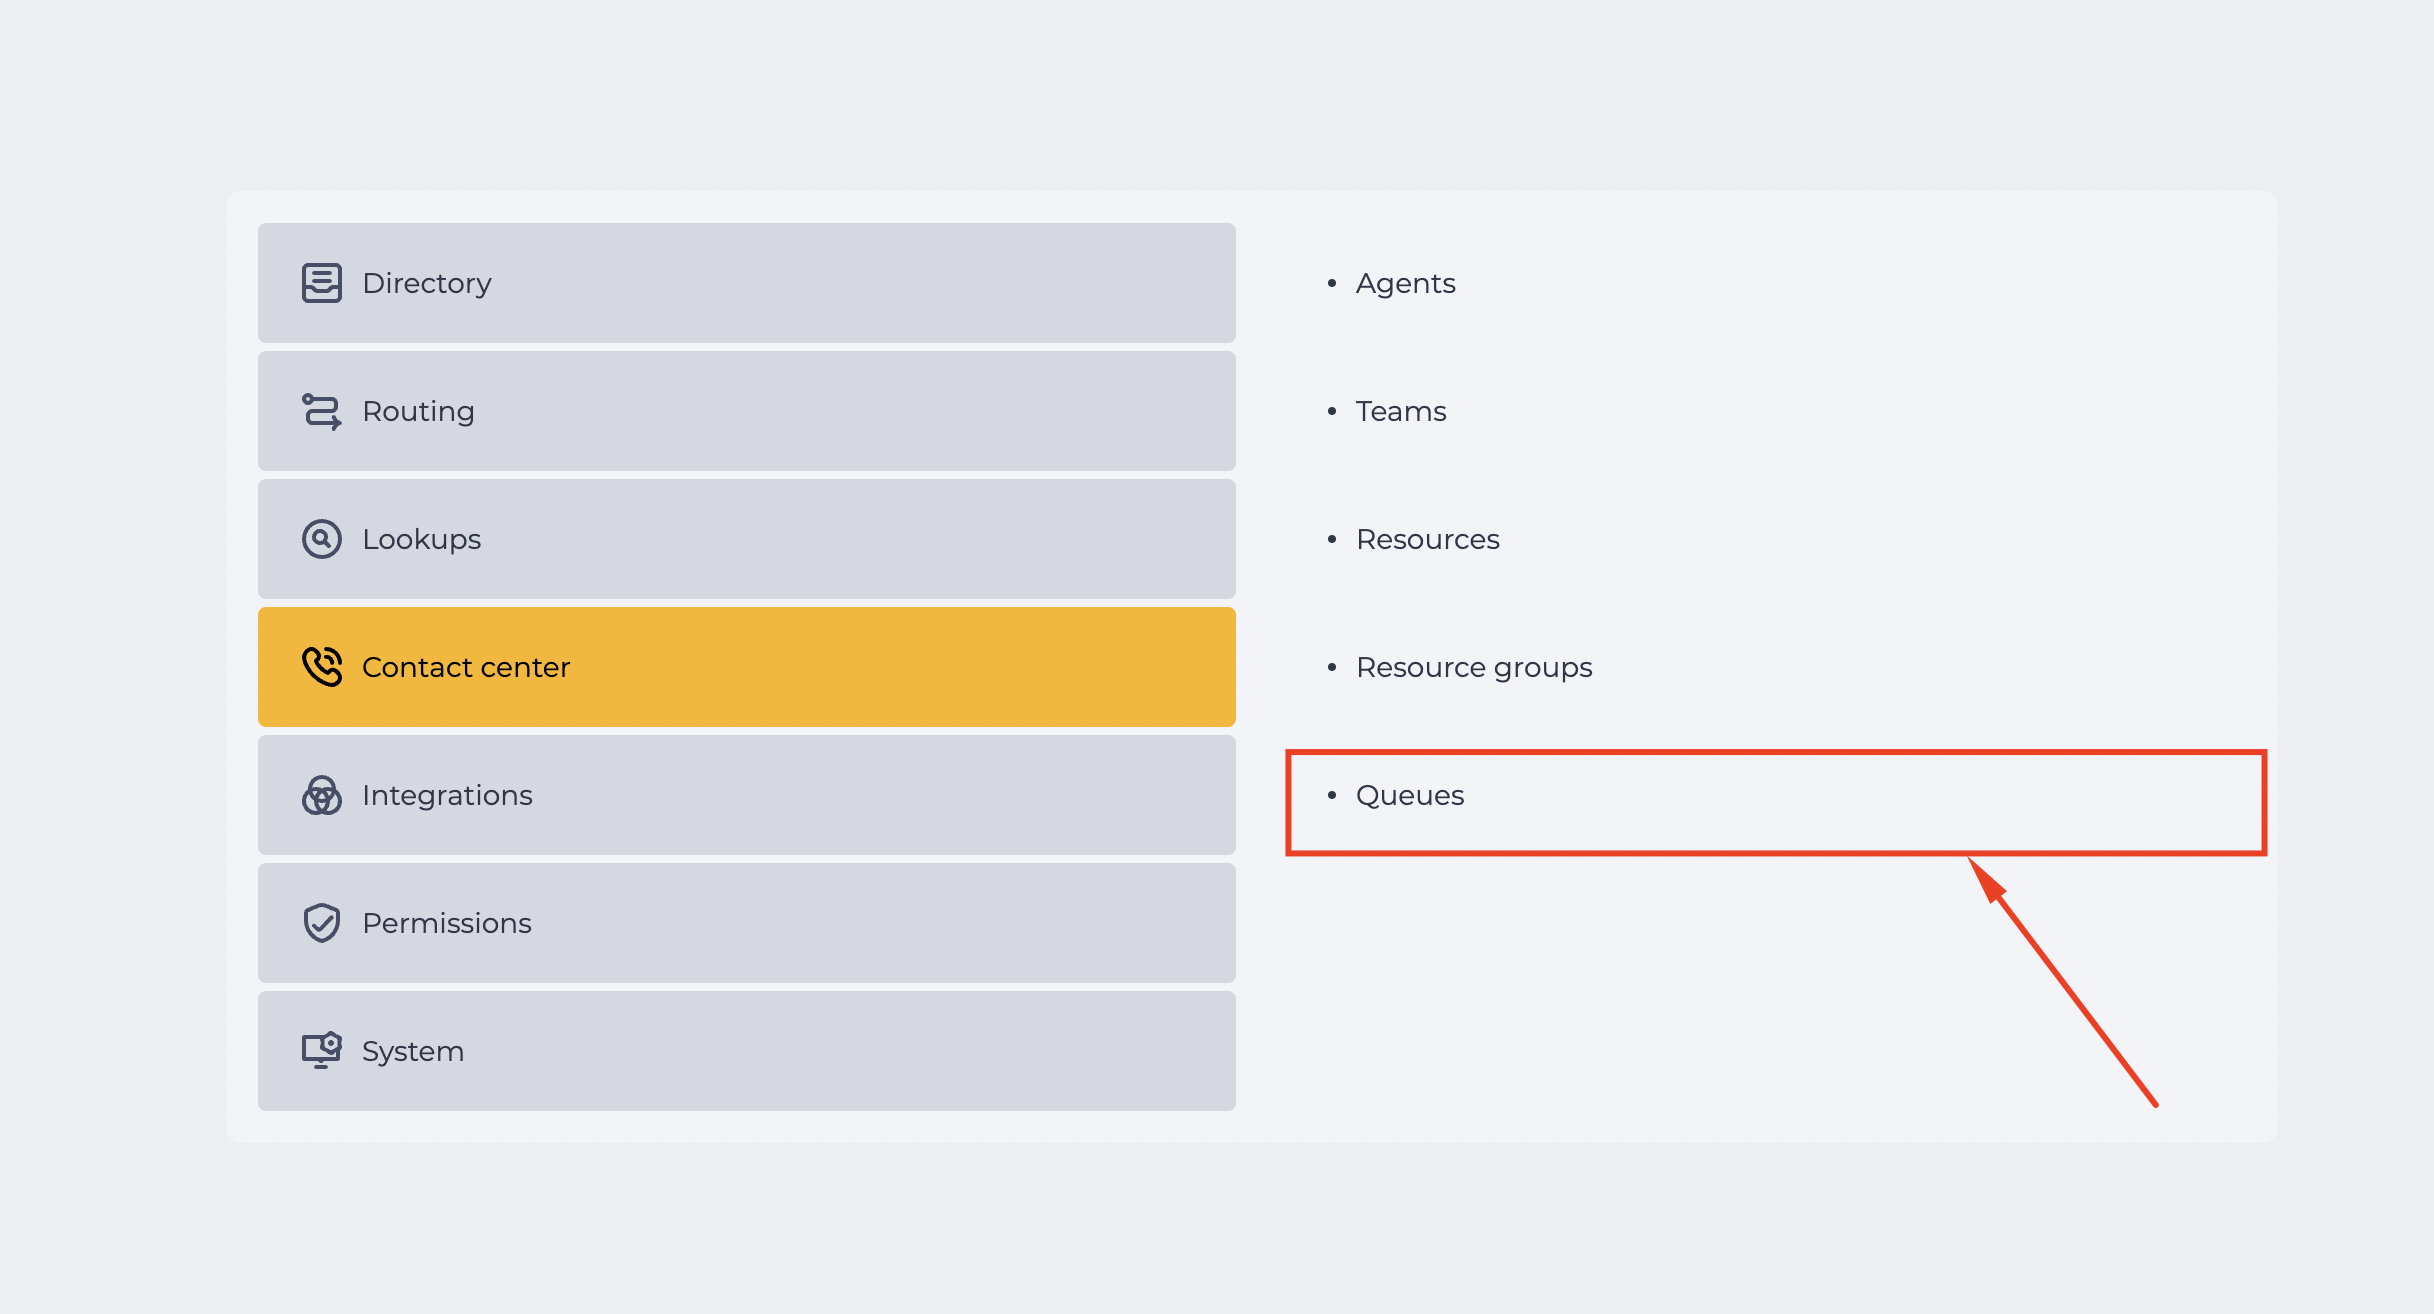
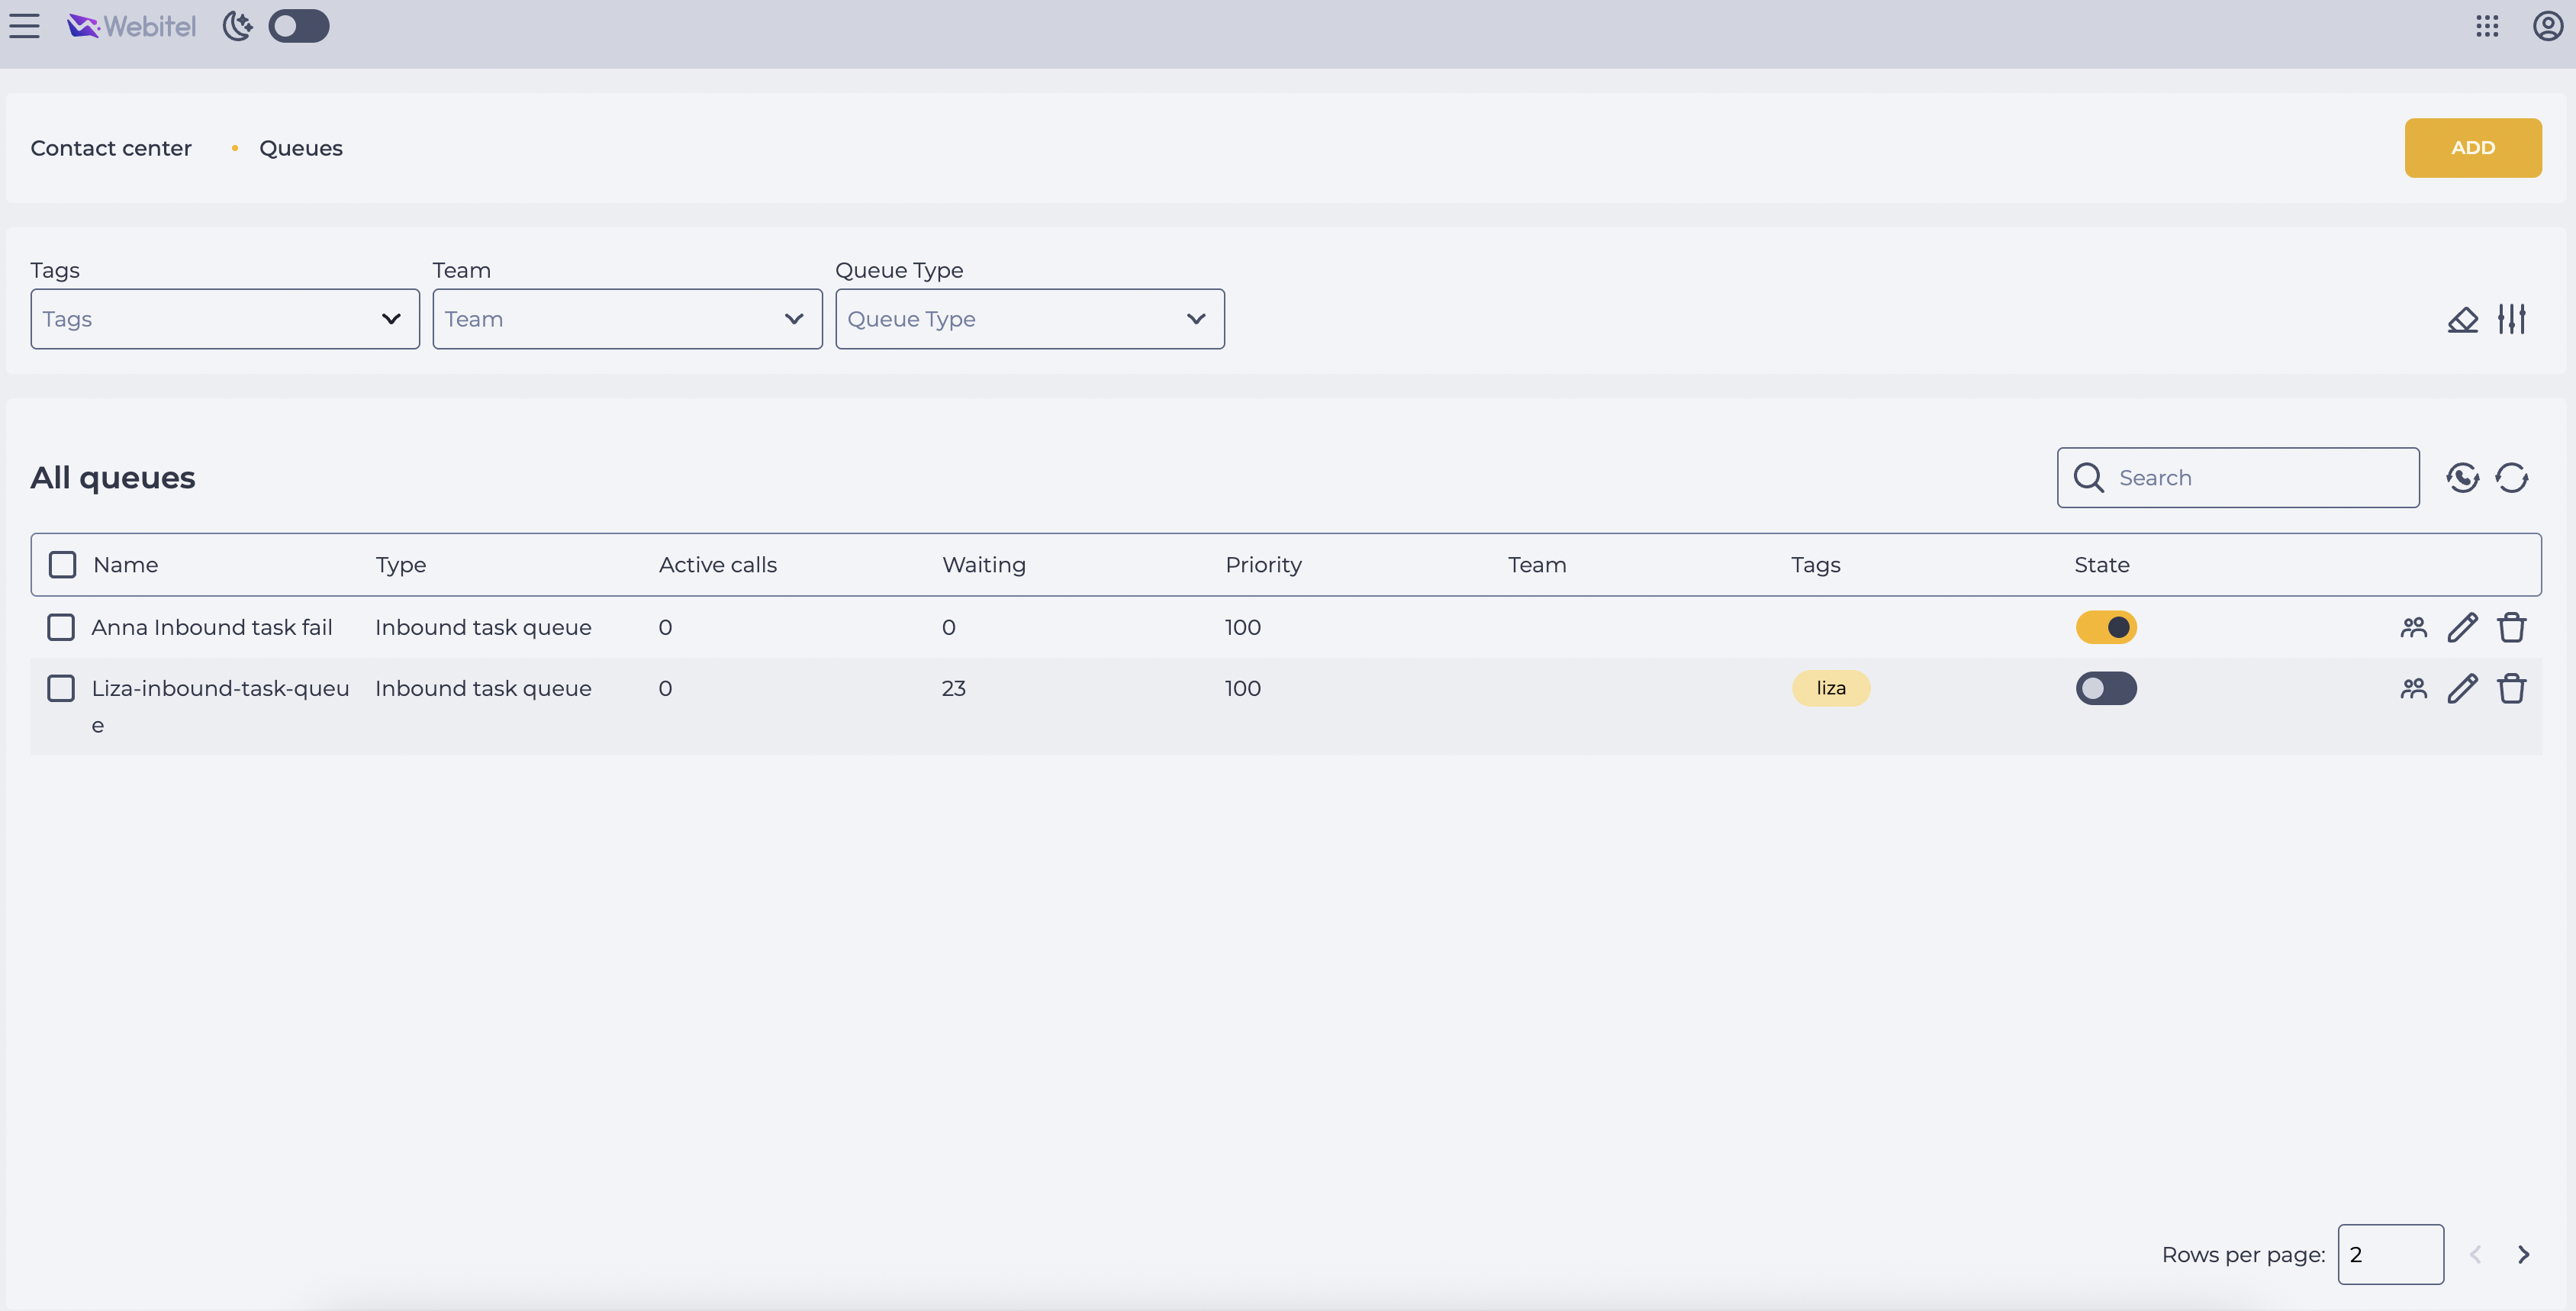
A user can only see the queues they have access to according to their role, and only if those queues are activated (status toggle is enabled). To check the queue status:
-
Go to the Admin application → Contact Center → Queues (Fig. 11).
-
Locate the desired queue in the record list (Fig. 12).
-
Check whether the toggle in the Status column is enabled –


5. Useful Links
-
Supervisor – the main page of the application.
-
Queues (Supervisor) – description of the queue monitoring functionality.
-
Queues – instructions for creating, editing, and deleting queues.