
1. Description
The Agents section is designed to display information about Agents for whom the current User is a Supervisor or a Team Administrator.
An Agent on this page can only see data about himself.
2. Main interface functionality
The Agents page consists of the following blocks (Fig. 1):
-
Search field (Fig. 1.(1));
-
Data export tool (Fig. 1.(2));
-
Filter panel (Fig. 1.(3));
-
Registry (Fig. 1.(4));
-
Pagination (Fig. 1.(5)).
.png?cb=d8ee1c448956eb312b87a8bc0768ae40)
3. Viewing the registry table
The table in the lower part of the page displays a list of all Agents available for the current User (Fig. 2).
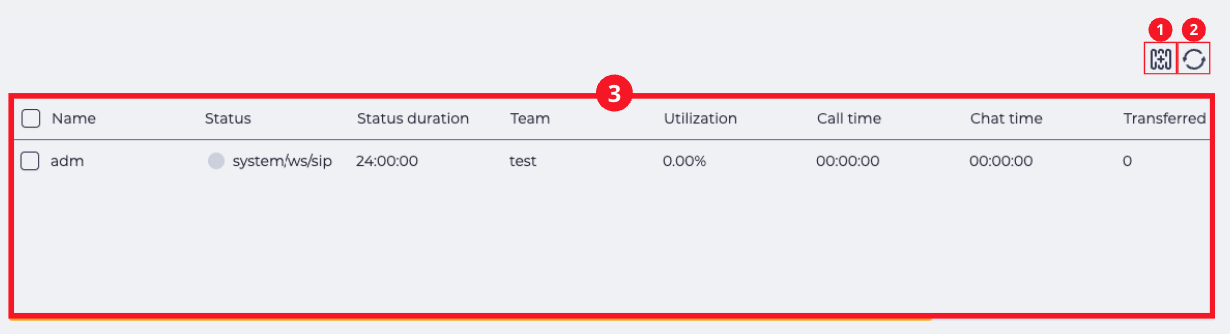
The information is updated automatically every 10 seconds, and it can also be updated manually using the corresponding icon 
The registry contains the following data:
-
Checkboxes — allow you to select one or more rows in the table.
-
Name — the Agent’s name. Clicking on it opens the Agent’s detailed card.
-
Status — the current status of the Agent (for example, Online, Pause, etc.).
-
Status duration — the amount of time the Agent has been in the current status.
-
Team — the name of the team to which the Agent is assigned.
-
Queues — the list of queues in which the Agent participates.
-
Utilization — the percentage of time in Online status when the Agent was actively working.
-
Call time — the total time spent in conversations with subscribers.
-
Chat time — the total time spent communicating in chats.
-
Transferred — the number of calls transferred to other Agents.
-
Missed — the number of calls that were not answered by the Agent.
-
Occupancy — the ratio of conversation time to Online time (in percent).
If the Agent is currently on a call, an icon 
If the User has the "Eavesdrop call" permission, the call monitoring feature becomes available.
Clicking the icon
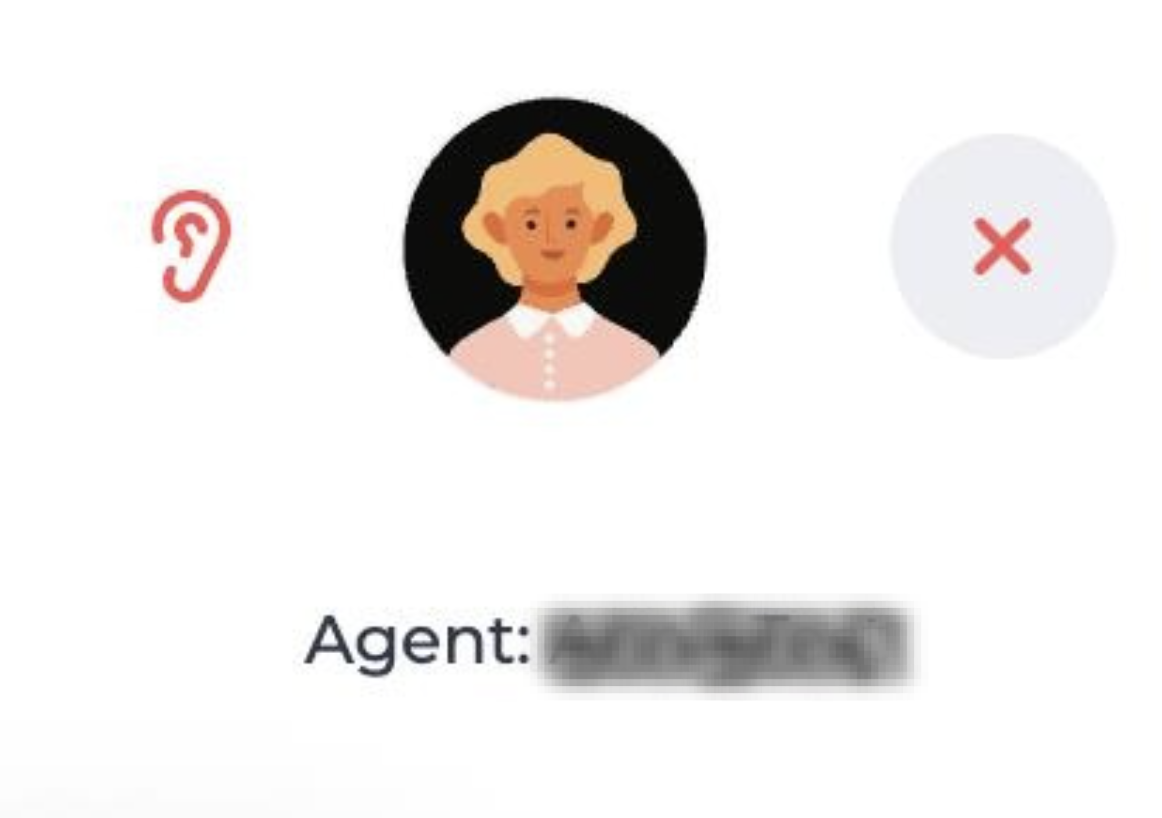
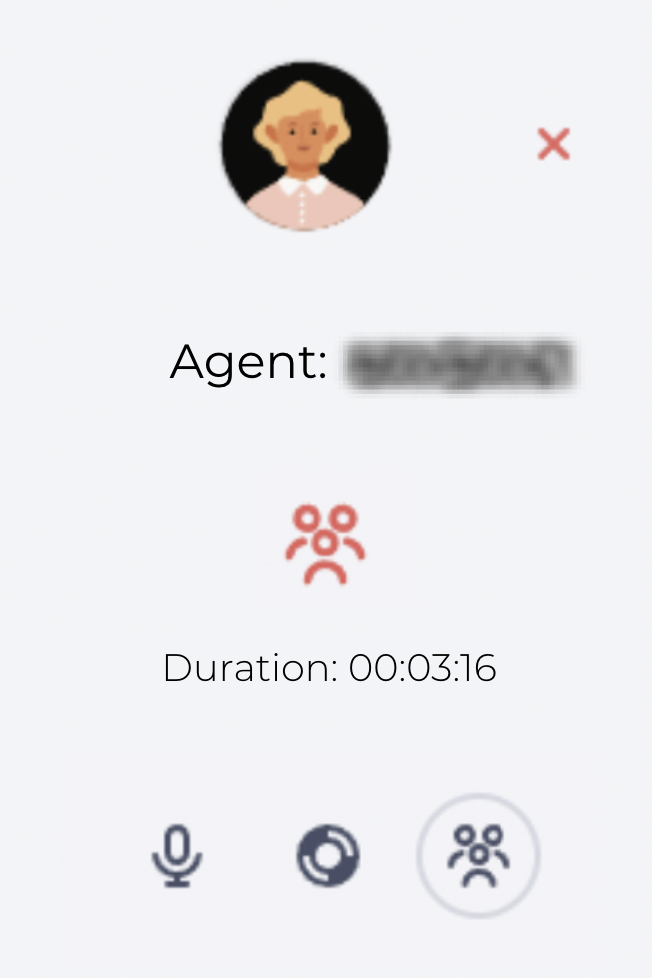
When hovering over the window, it expands (Fig. 4).
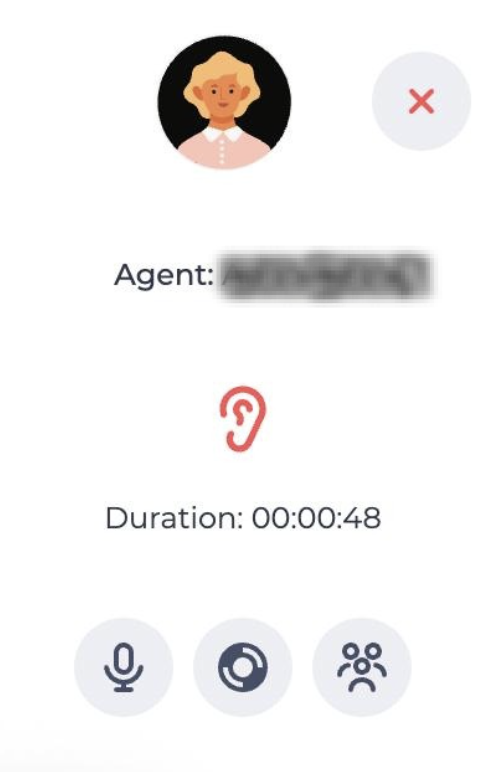
The expanded window provides more detailed information, namely:
-
the Agent’s name;
-
the amount of time spent in active call listening mode.
Clicking the icon 
3.1. Whisper and Conference Modes
After connecting to a call in listening mode, you can change the level of participation by switching to whisper mode or conference mode. To do this, use the microphone icon in the listening window.
Switching modes:
-
In the listening window, click the microphone icon:
-

-

-
Next, select the required mode.
3.1.1. Whisper Mode
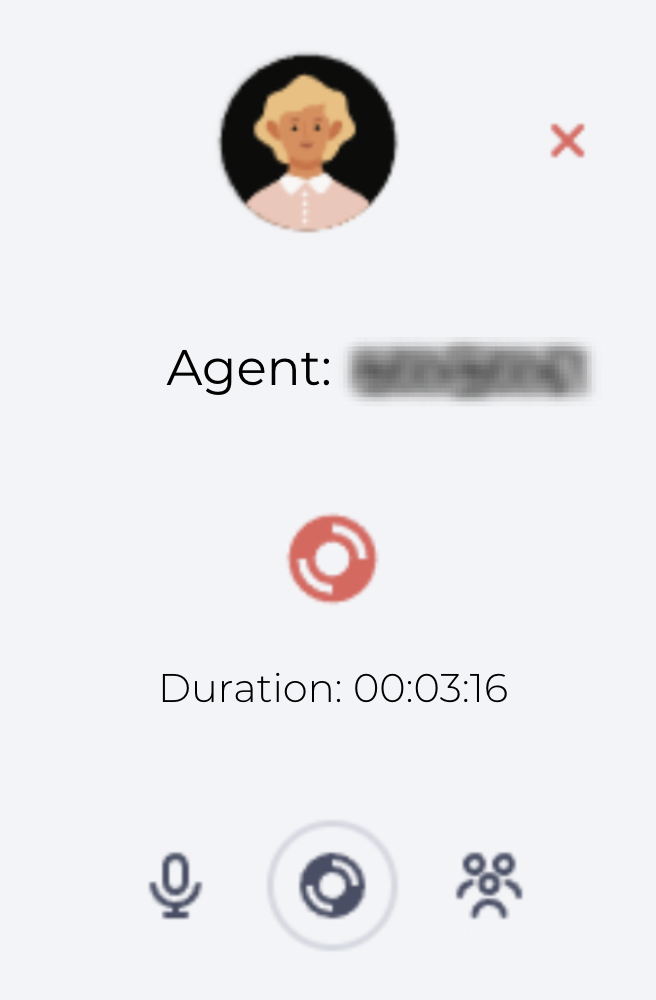
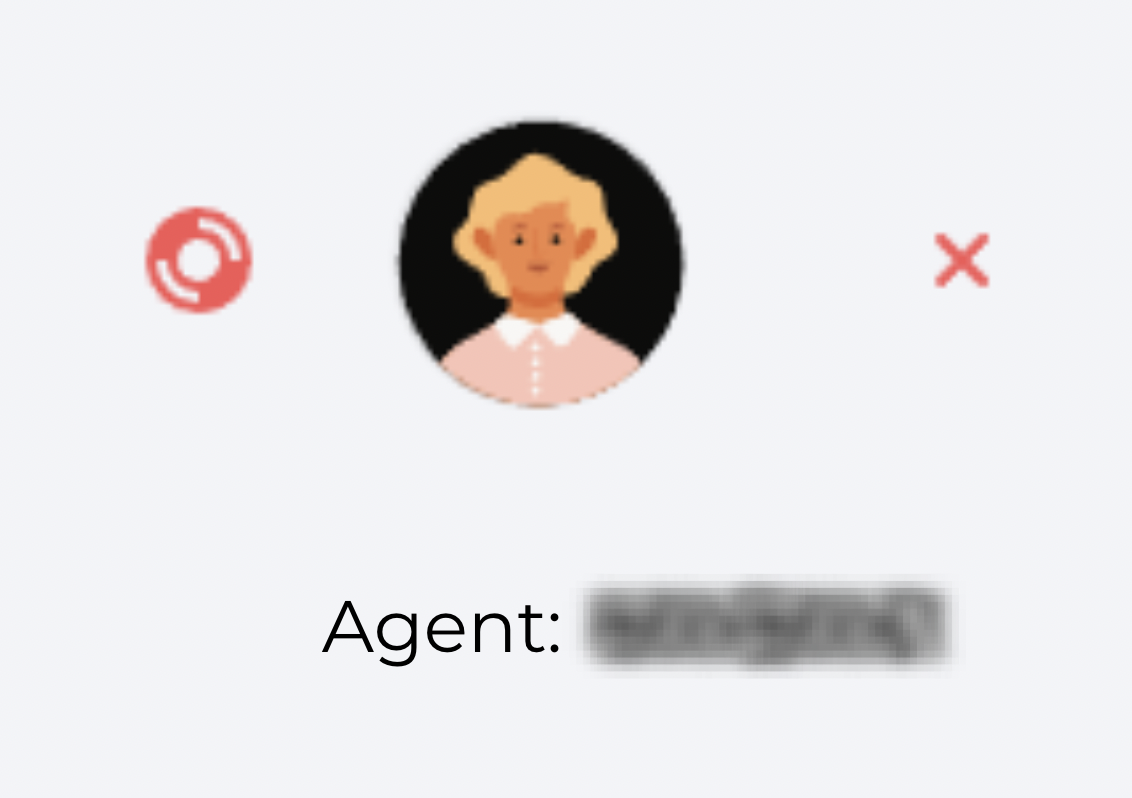
In this mode, only the Agent can hear your voice. The Subscriber cannot hear you.
-
To enable — click the Whisper icon at the bottom of the window

-
If you move the cursor away from the listening window, the minimized window in whisper mode will look as follows (Fig. 6):
3.1.2. Conference Mode
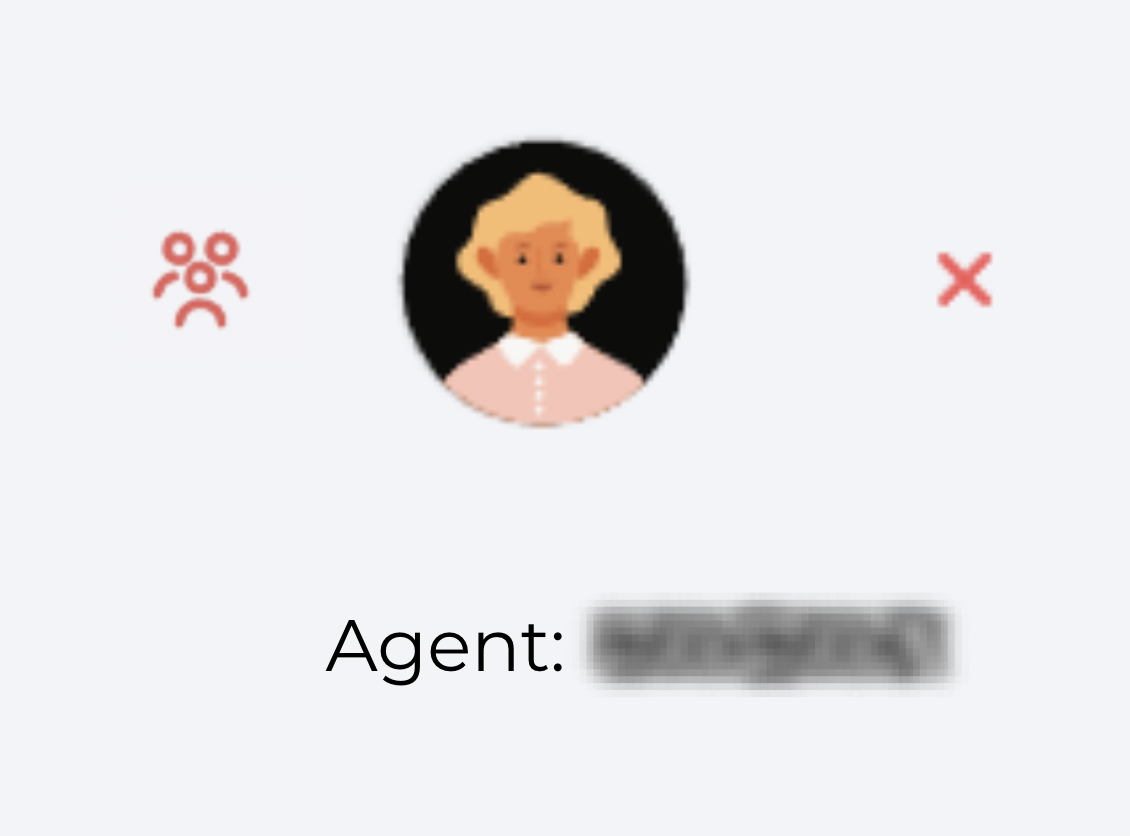
In this mode, both sides — the Agent and the Subscriber — can hear your voice.
-
To enable — click the Conference icon

-
If you move the cursor away from the listening window, the minimized window in conference mode will look as follows (Fig. 8):
To exit any participation mode, click the microphone icon again — you will return to Listening mode.
Additional tools are also located above the registry table:
-
Refresh icon

-
Select visible columns tool — allows configuring which fields are displayed in the table.
-
Filtering and search — help limit the displayed data according to specified criteria.
-
Export tool — designed for downloading a file with data from the registry.
3.2. How to refresh the table manually
-
Click the icon
-
The data will be automatically reloaded — without the need to refresh the page.
By default, the update occurs automatically every 10 seconds.
3.3. How to change the set of columns in the table
-
Click the Select visible columns icon

-
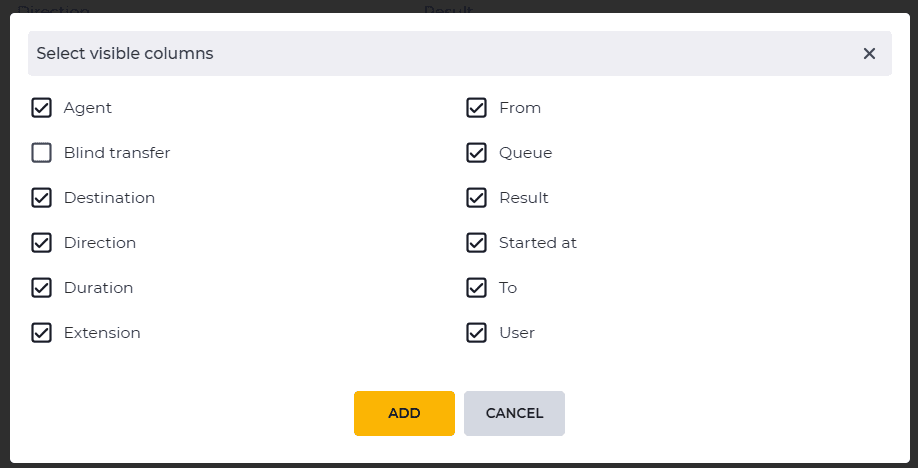
The Select visible columns modal window opens (Fig. 9).
-
Check the boxes next to the columns you want to display in the table. The changes are saved automatically.
-
To hide extra columns — clear the corresponding checkboxes.
-
If the field is selected — the column will be displayed.
-
If the field is not selected — the column will not be displayed.
-
3.4. Filtering Agents
The filter panel is located at the top of the Agents page. It helps quickly find the required Agents according to the specified parameters.
It includes:
-
Filtering fields (Fig. 10.(1));
-
Reset filters button (Fig. 10.(2));
-
Expand filters button (Fig. 10.(3)).

Basic filtering fields:
-
Status:
-
Online;
-
Offline;
-
Pause;
-
Forced break.
-
-
Queue;
-
Skill;
-
Team;
-
Supervisor;
-
Auditor;
-
Location;
-
Utilization progress:
-
< 50%;
-
< 70%;
-
< 90%;
-
< 100%.
-
Note! Depending on the user’s rights, the available fields may differ.
To apply a filter:
-
Click on the required field.
-
Select a value from the list. You can select several values simultaneously (for example, multiple queue types).
-
The results in the table will update automatically according to the selected conditions.
3.4.1. Additional filter actions
-
To reset all selected filters — click the icon

-
To expand the filter panel (if some fields are hidden), click the button with the icon

3.5. Viewing table pages
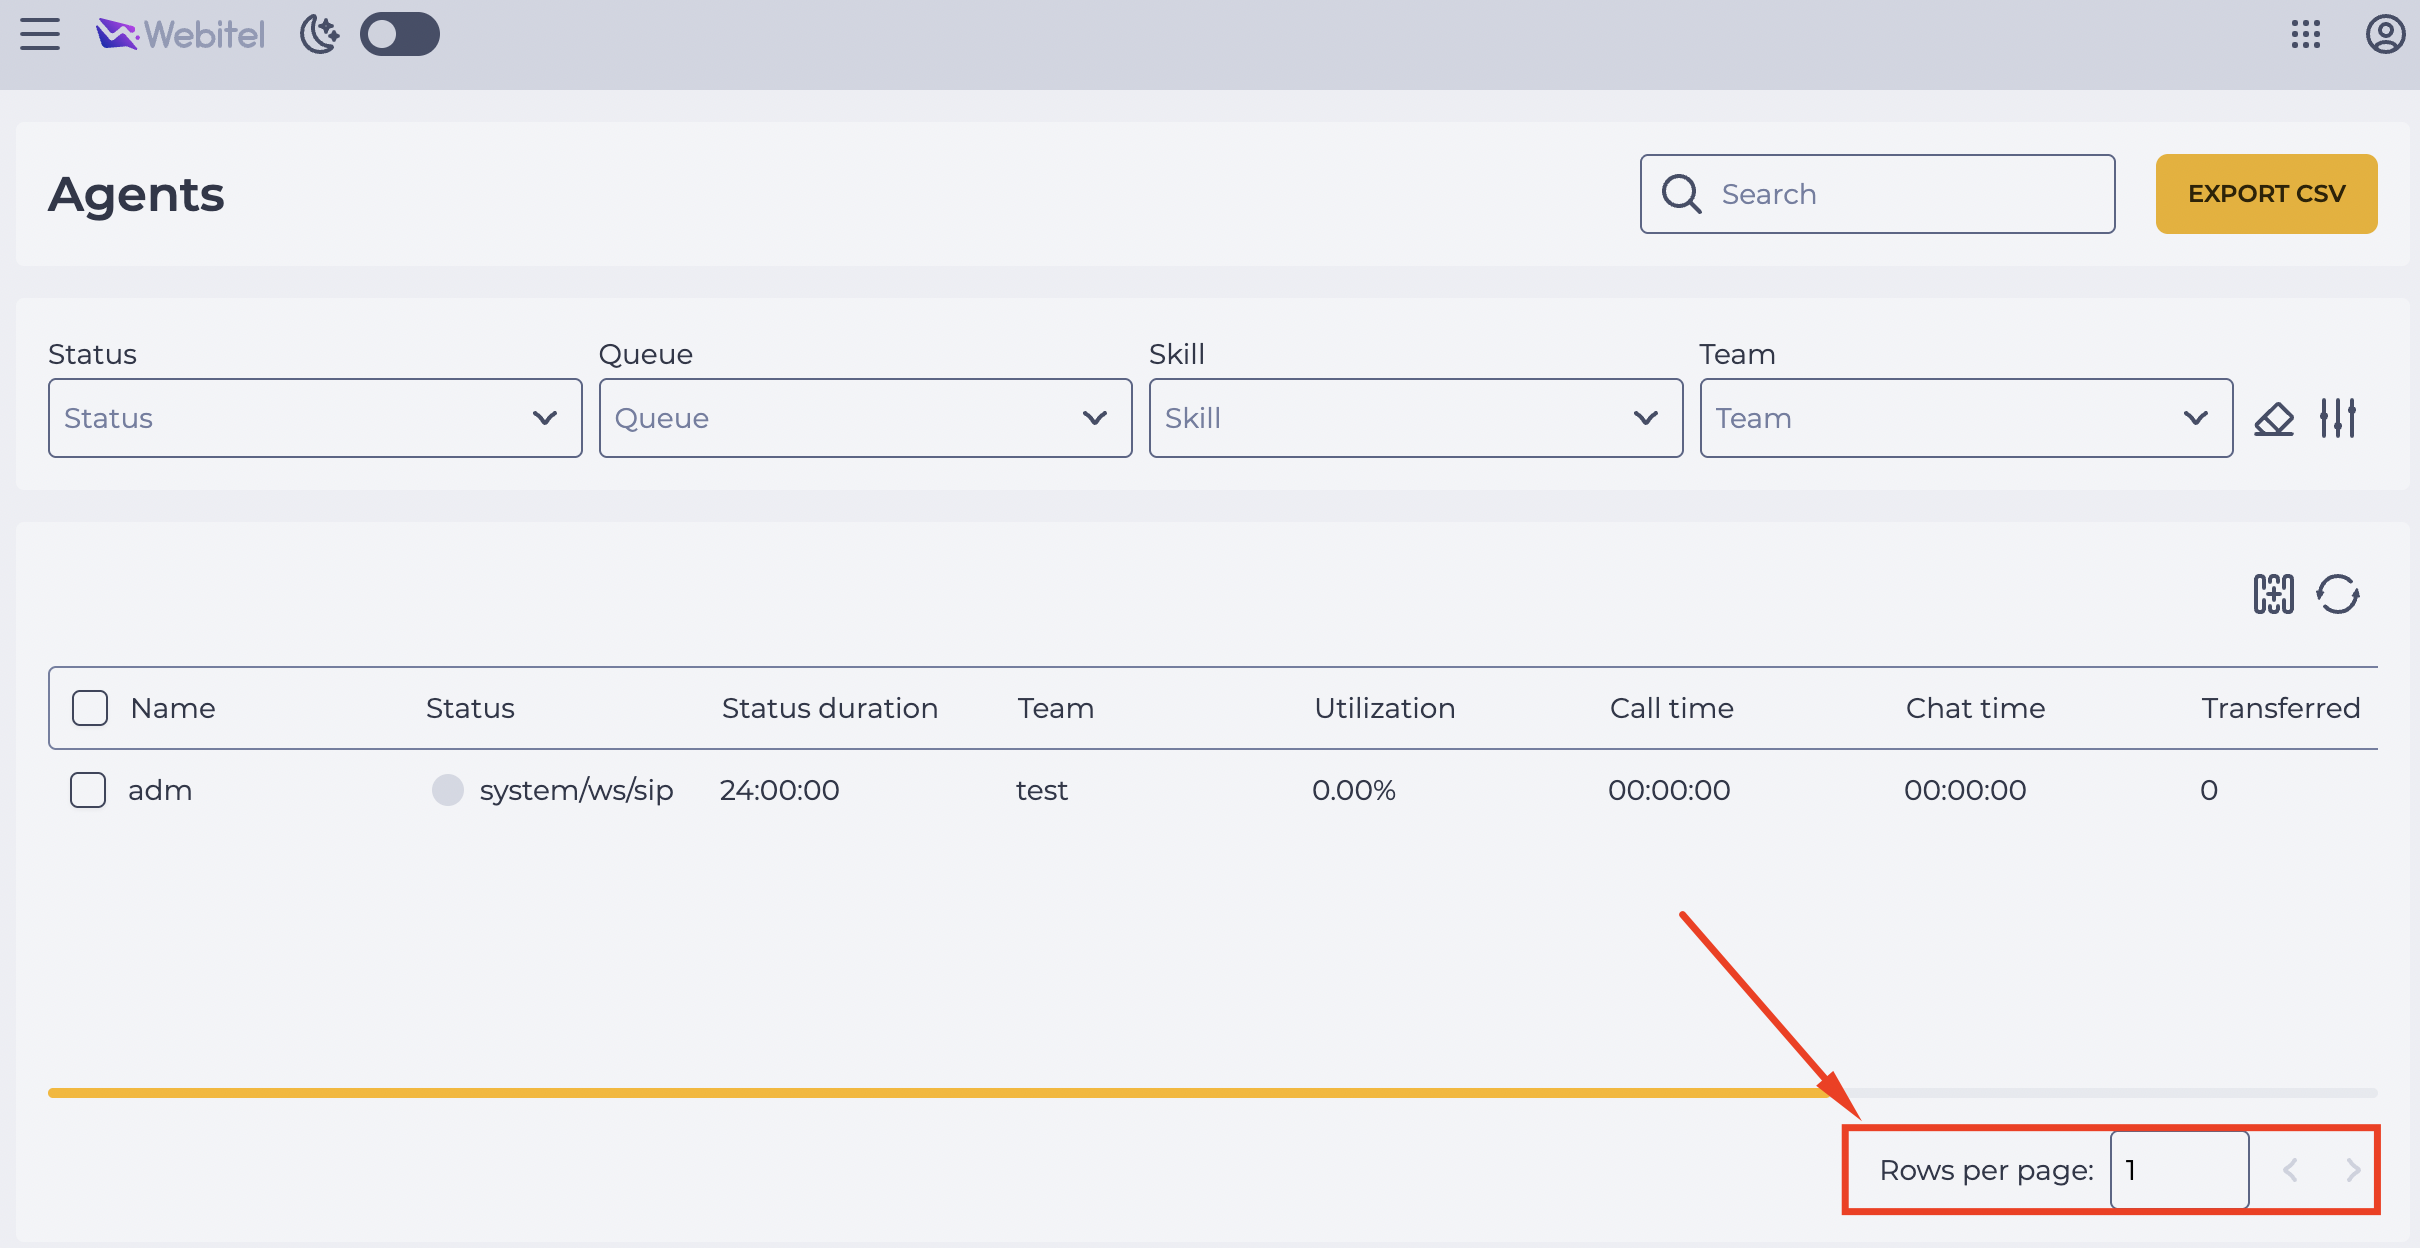
Pagination elements are available below the registry table:
-
Buttons to move to the previous or next page.
-
Rows per page input: 10, 25, 50, etc.
3.6. Searching for an Agent
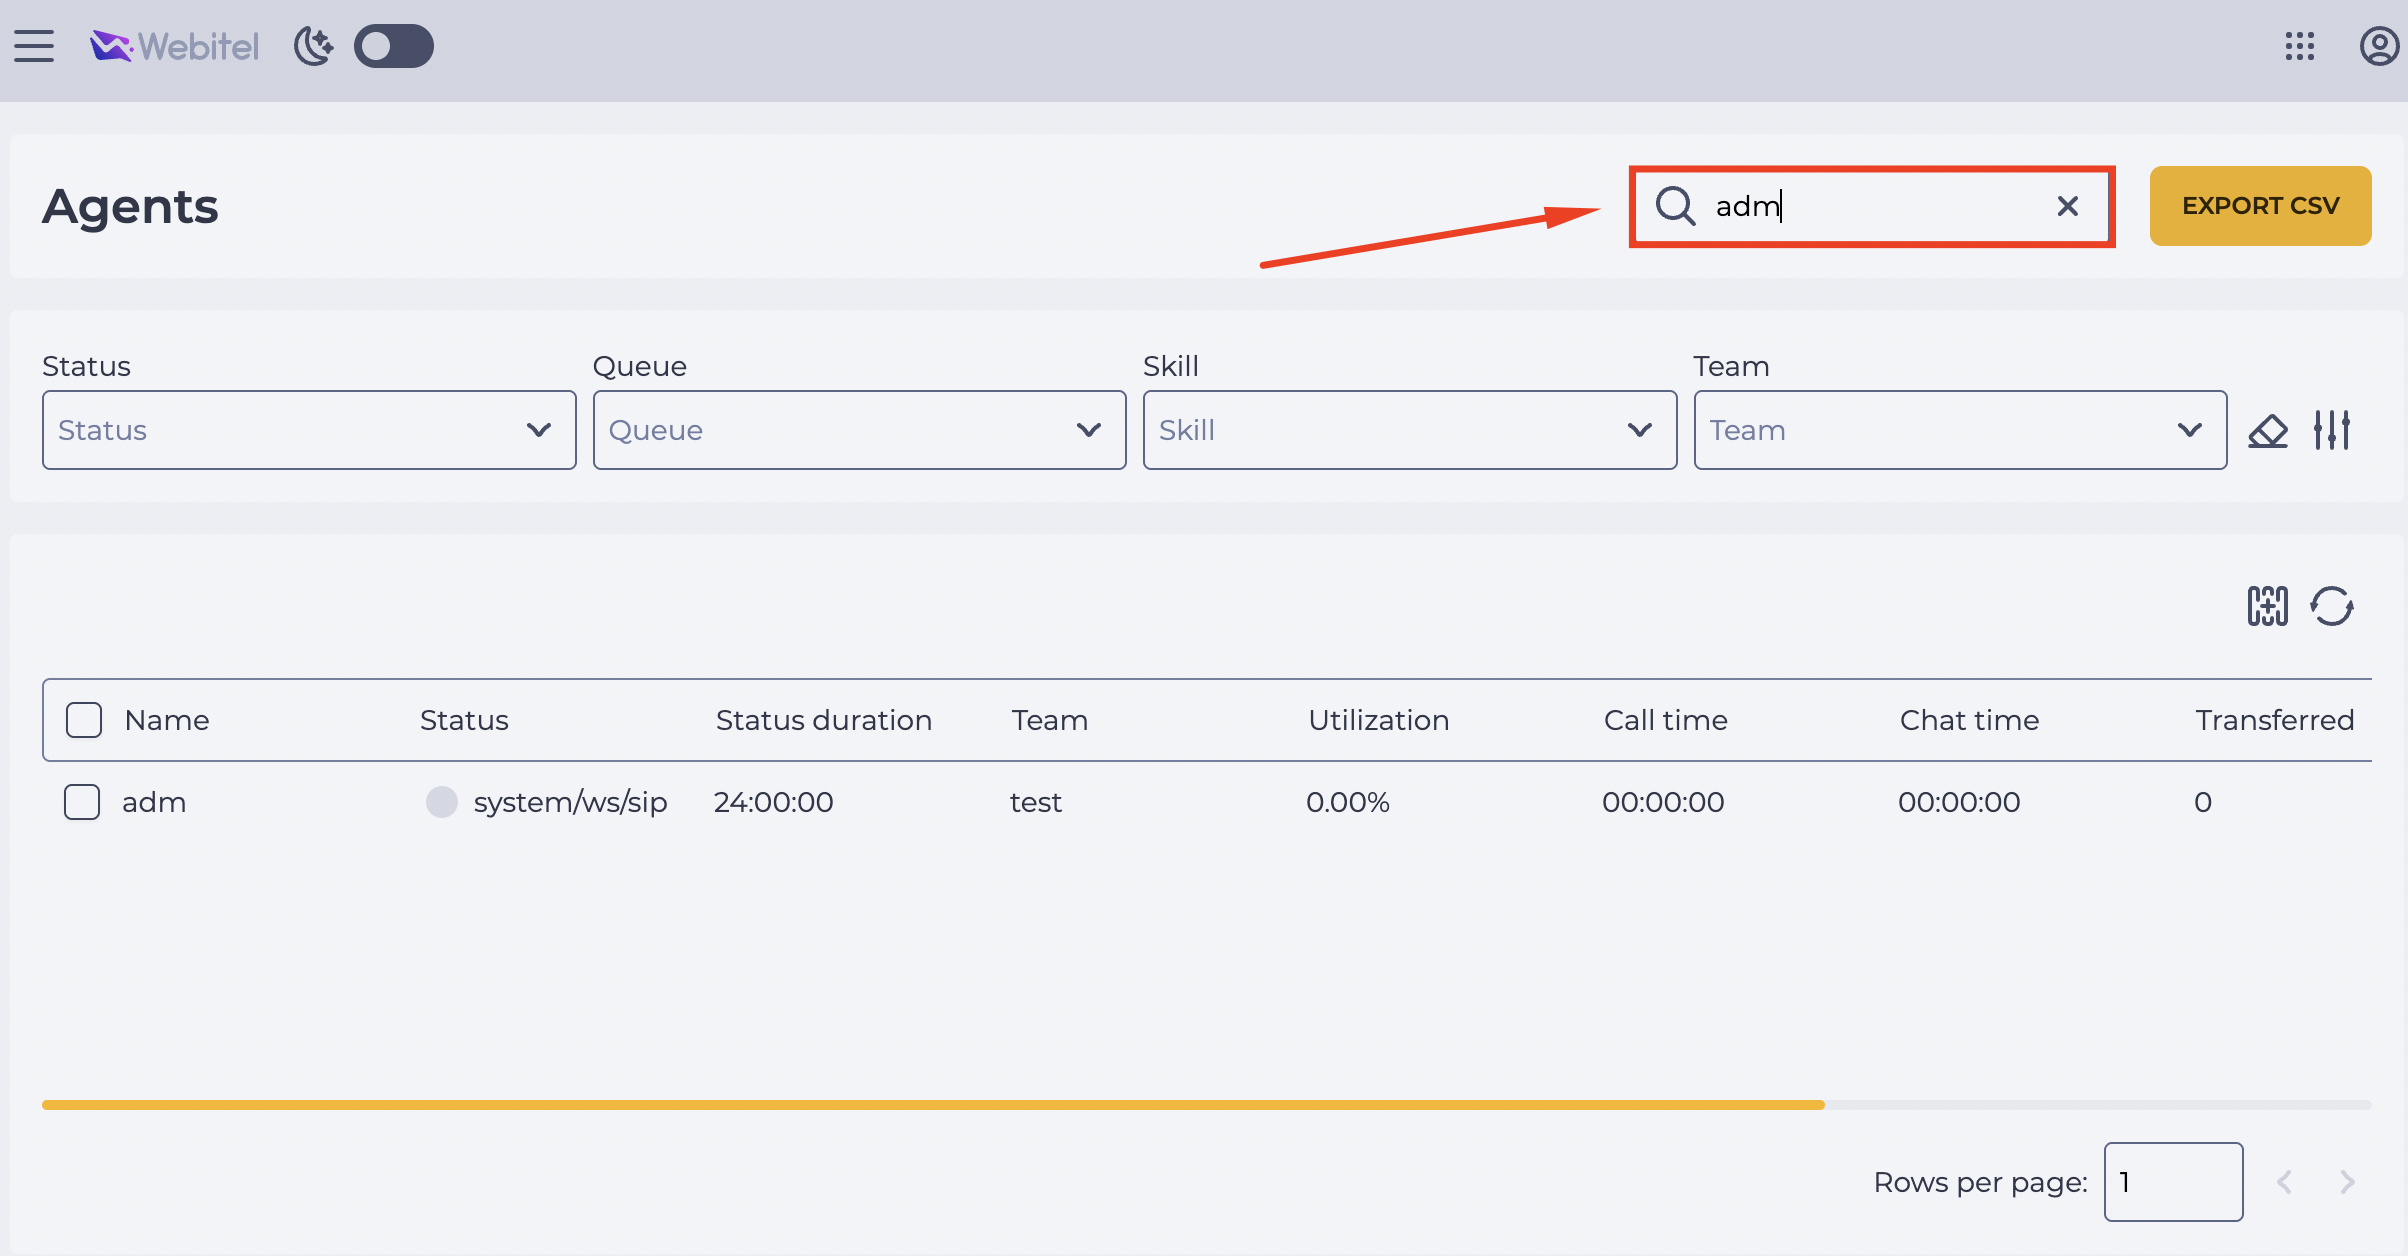
To quickly find an Agent, use the search field at the top of the page (Fig. 12).
Start typing the Agent’s name — the system will immediately display the matching options. You can use an asterisk * to find partial matches. For example:
-
*Petrenko— shows all Agents whose names end with "Petrenko"; -
adm*— shows all Agents whose names begin with "adm".
To clear the query and return to the full list, click the icon 
3.7. Exporting the Agents table
To save the current table with Agents:
-
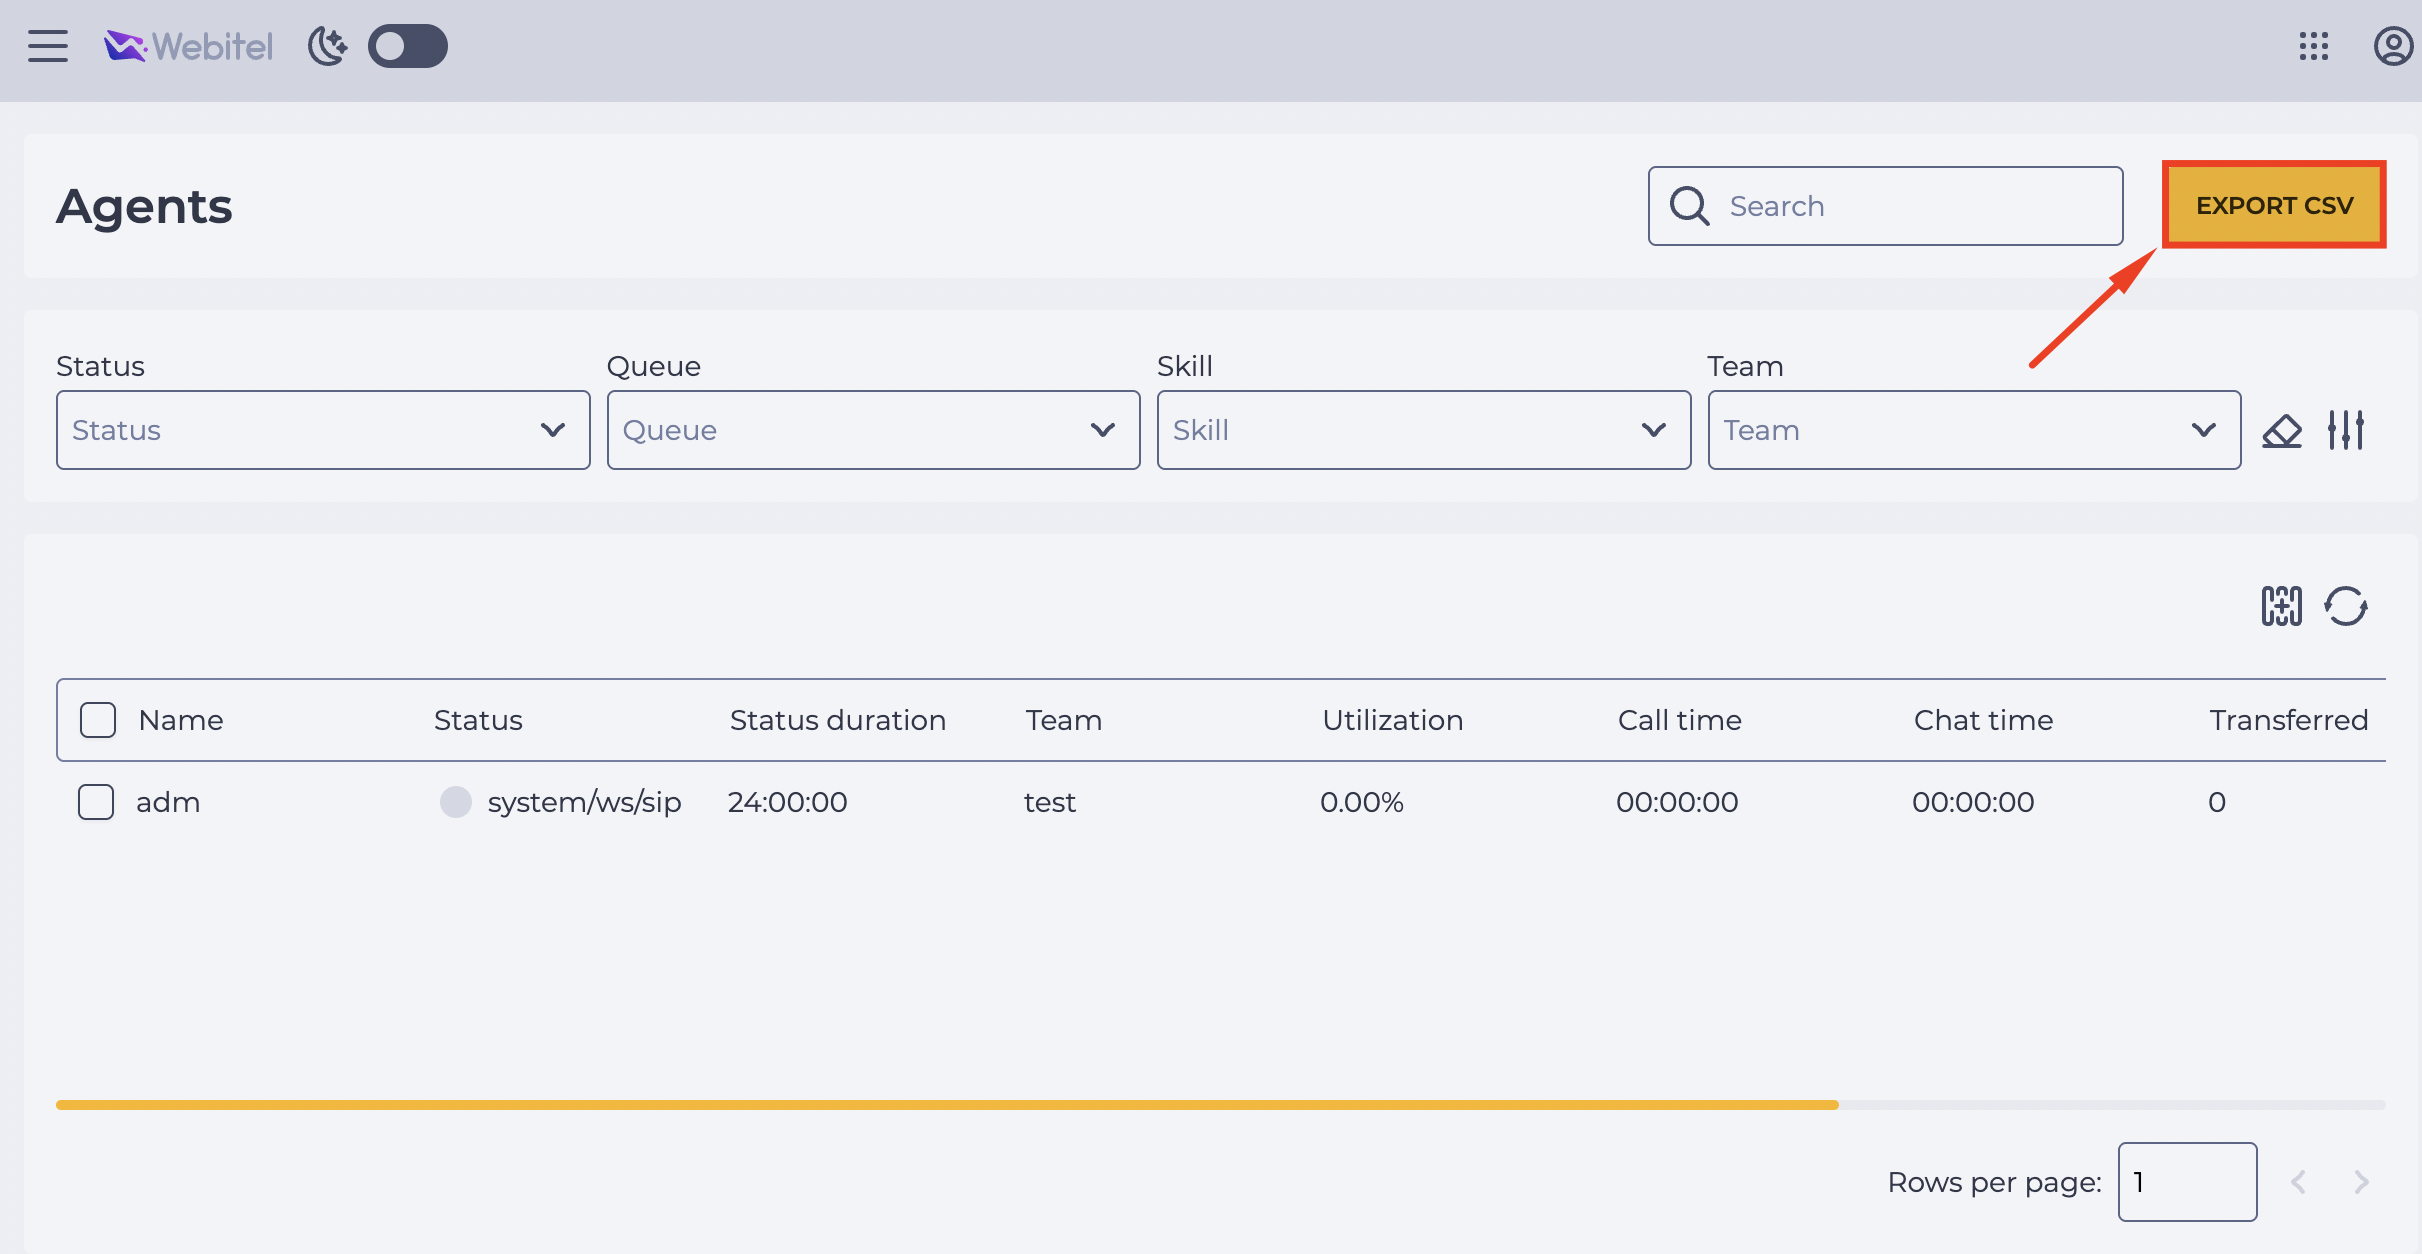
Click the Export CSV button in the upper-right corner (Fig. 13).
-
The file agents.csv will be downloaded automatically.
-
The data in the file will correspond to what is displayed in the table at the moment of export (Fig. 14).

4. Useful links
-
Supervisor – the main application page.
-
Agents (Supervisor) – description of the page functionality.
How to work with tabs of the section:
-
Instruction for working with the General tab of the Agents section (Supervisor) -
Instruction for working with the Work log tab of the Agents section (Supervisor) -
Instruction for working with the State history tab of the Agents section (Supervisor) -
Instruction for working with the Skills tab of the Agents section (Supervisor)