
1. Importing Contacts: Template Creation and CSV File Structure
To import contact data into a campaign, you must first configure a field mapping template and then prepare a CSV file with the appropriate structure.
1.1. Configuring the Import Template
-
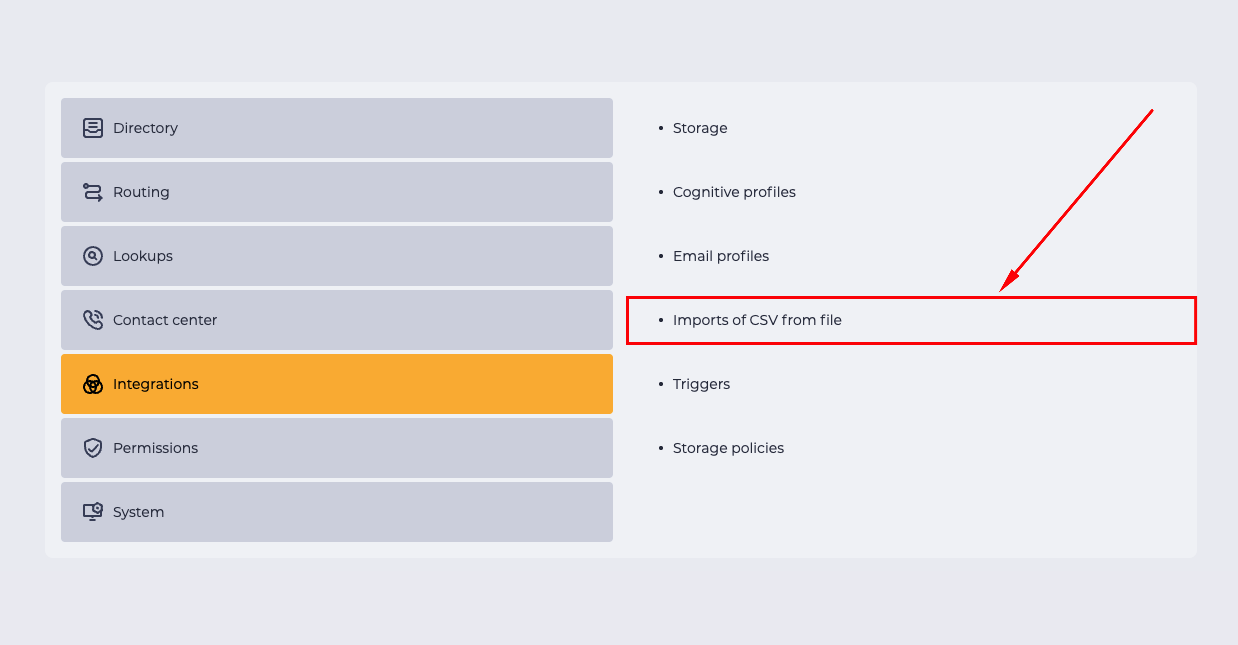
Go to Admin → Integrations → Imports of CSV from file (Fig. 1).
-
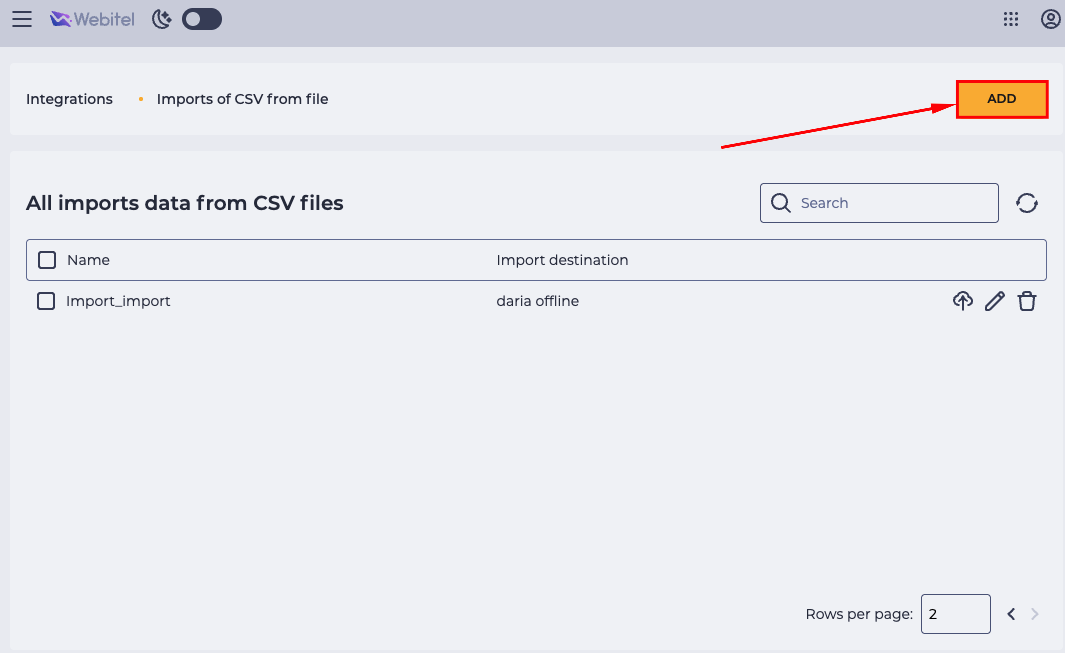
Click the Add button to create a new template (Fig. 2).
-
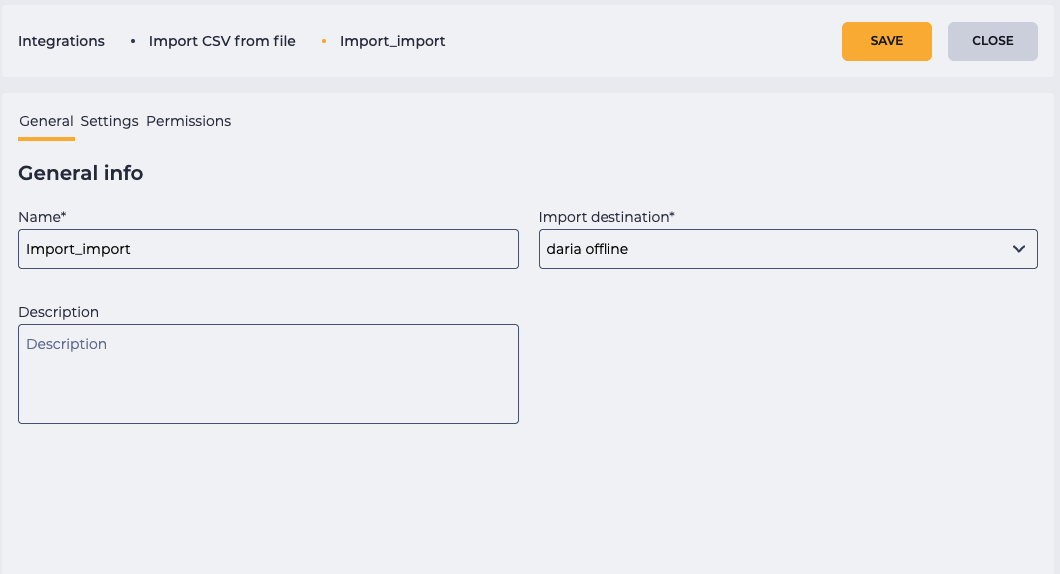
In the General tab (Fig. 3):
-
Enter the template Name — this will be a unique identifier for future reference.
-
Select the Import destination — the queue into which the subscribers will be imported.
-
-
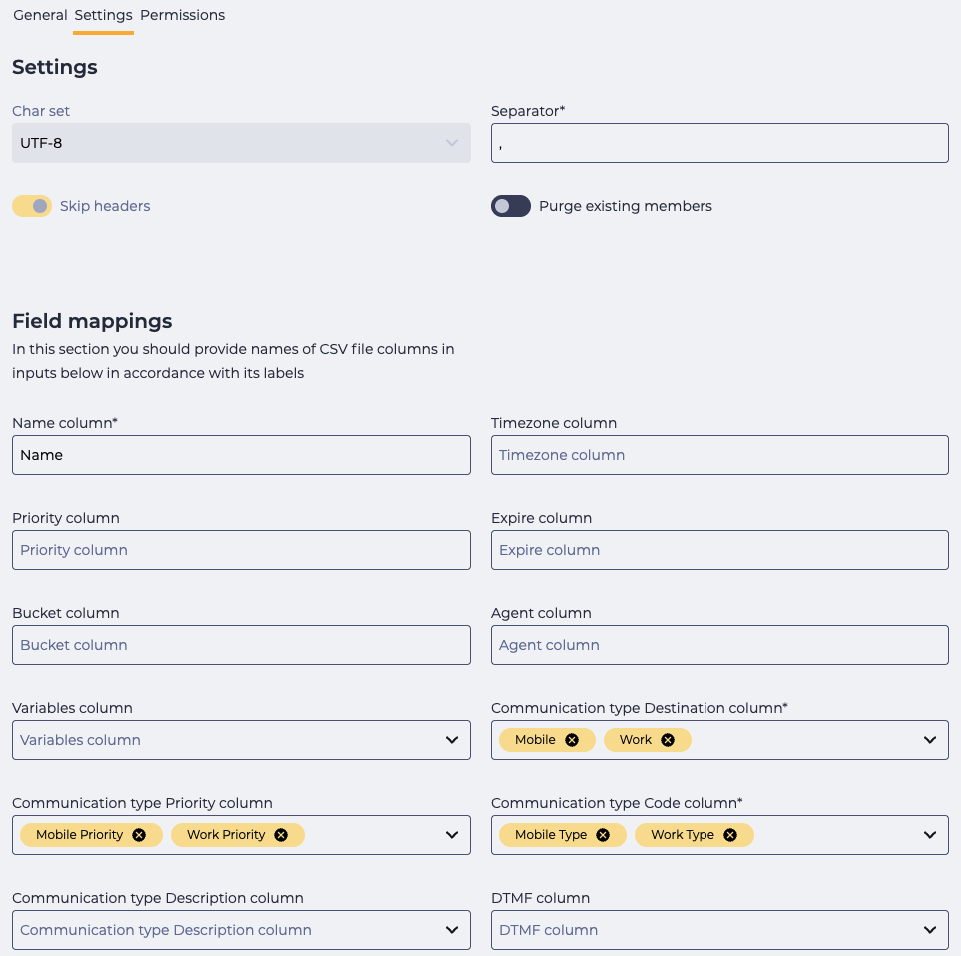
In the Settings tab (Fig. 4), specify the column headers that will be used in the CSV file. The values must exactly match the headers in the CSV file.
Required fields:
-
Name column — the column that contains the subscriber’s name (e.g.,
Name). -
Communication type Destination column — the column containing the communication channel (e.g., phone number,
Mobile). -
Communication type Code column — the type code for the communication channel (e.g.,
Work Typefor a work number). This code can be found in the Communication type directory under the Code column.
Optional fields:
-
Timezone column — subscriber's timezone.
-
Priority column — dialing priority (a higher number means higher priority).
-
Expire column — the expiration date of the contact.
-
Bucket column — the bucket ID.
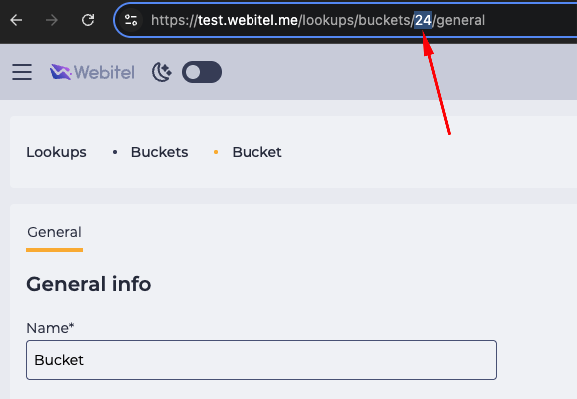
To find the bucket ID, go to Admin → Dictionaries → Buckets, open the desired bucket, and copy the numeric ID from the URL (Fig. 5).
-
Agent column — ID of the agent assigned to the contact.
The agent ID can also be found in the URL of the agent’s detail page.
-
Variables column — dynamic variables used in the call scenario.
-
Communication type Priority column — used when the contact has multiple communication channels (e.g., several phone numbers).

The sequence of values in the Communication type Destination column must match those in Communication type Priority and Communication type Code.
-
Communication type Description column — additional description of the contact method.
-
DTMF column — values for dual-tone multi-frequency signaling.
Once all required fields are set, the Save button becomes active. Required fields are marked with an asterisk *.
1.2. Preparing the CSV File
After saving the template, create a CSV file where each row corresponds to one member, and each column corresponds to a data type defined in the template.
When saving the file, make sure to select "CSV file" as the file type.
1.3. Uploading the File
-
Go to Admin → Integrations → Imports of CSV from file.
-
Find the required template and click the upload icon
-
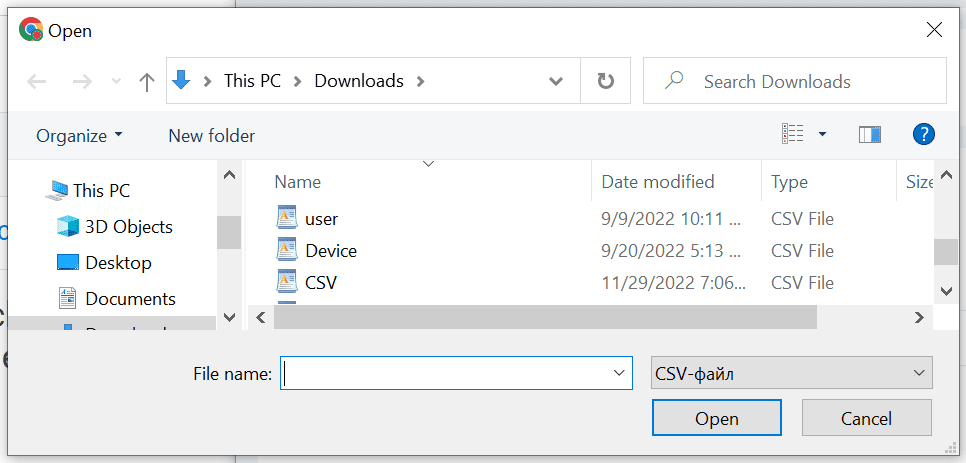
Select the necessary file on your device and click the “Open” button (depending on your OS, the file selection window may vary) (Fig. 7).
-
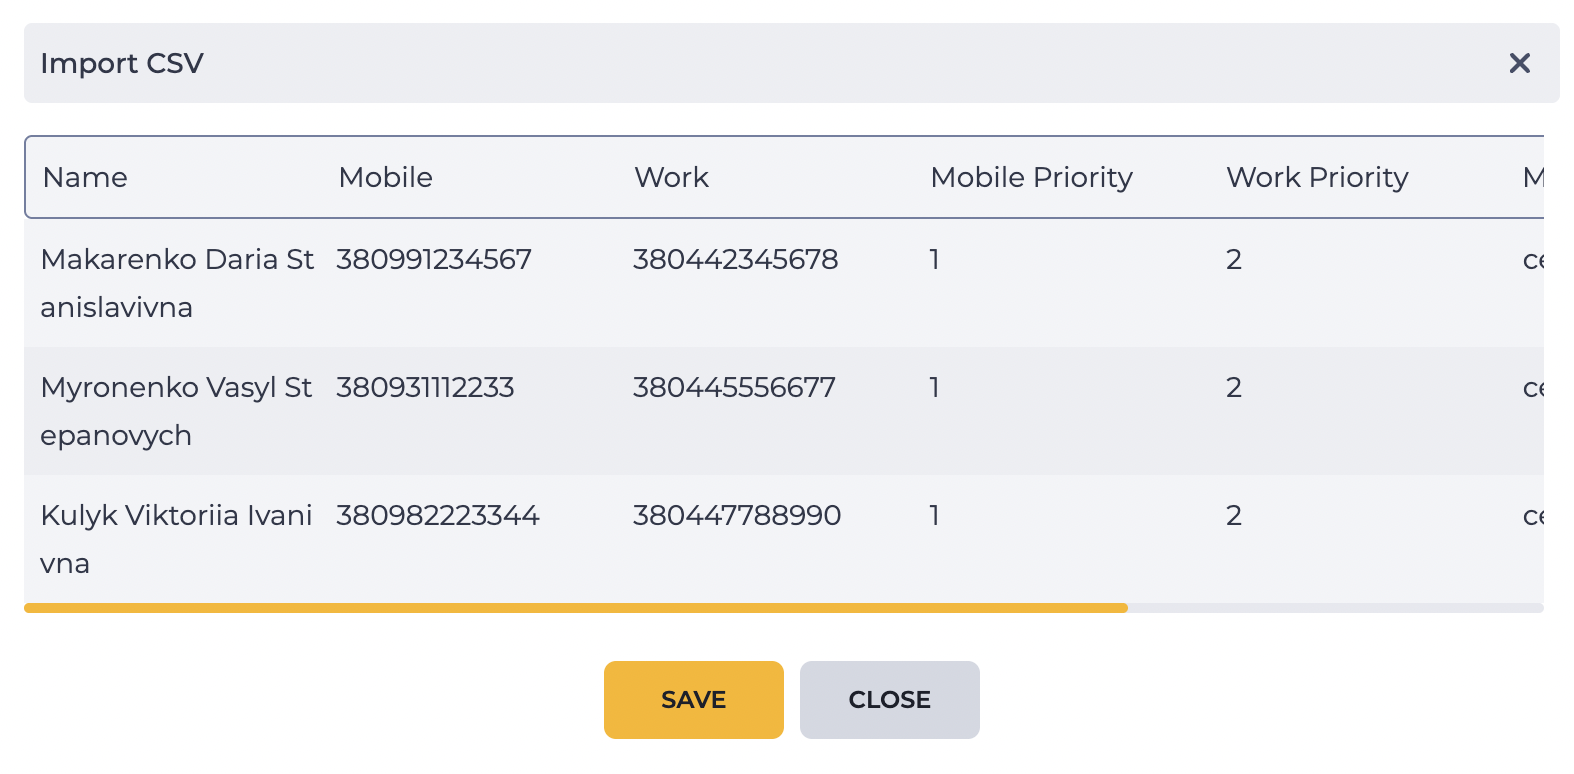
After the upload, a modal preview window will open (Fig. 8).
-
Click the “Save” button to start the import.
If the uploaded file does not contain the column headers specified in the template, the import will not be performed.
2. Deleting Contacts: Manual and Automated
In certain scenarios, it may be necessary to remove contacts from queues—either manually or by ID.
2.1. Manual Deletion of Contacts
-
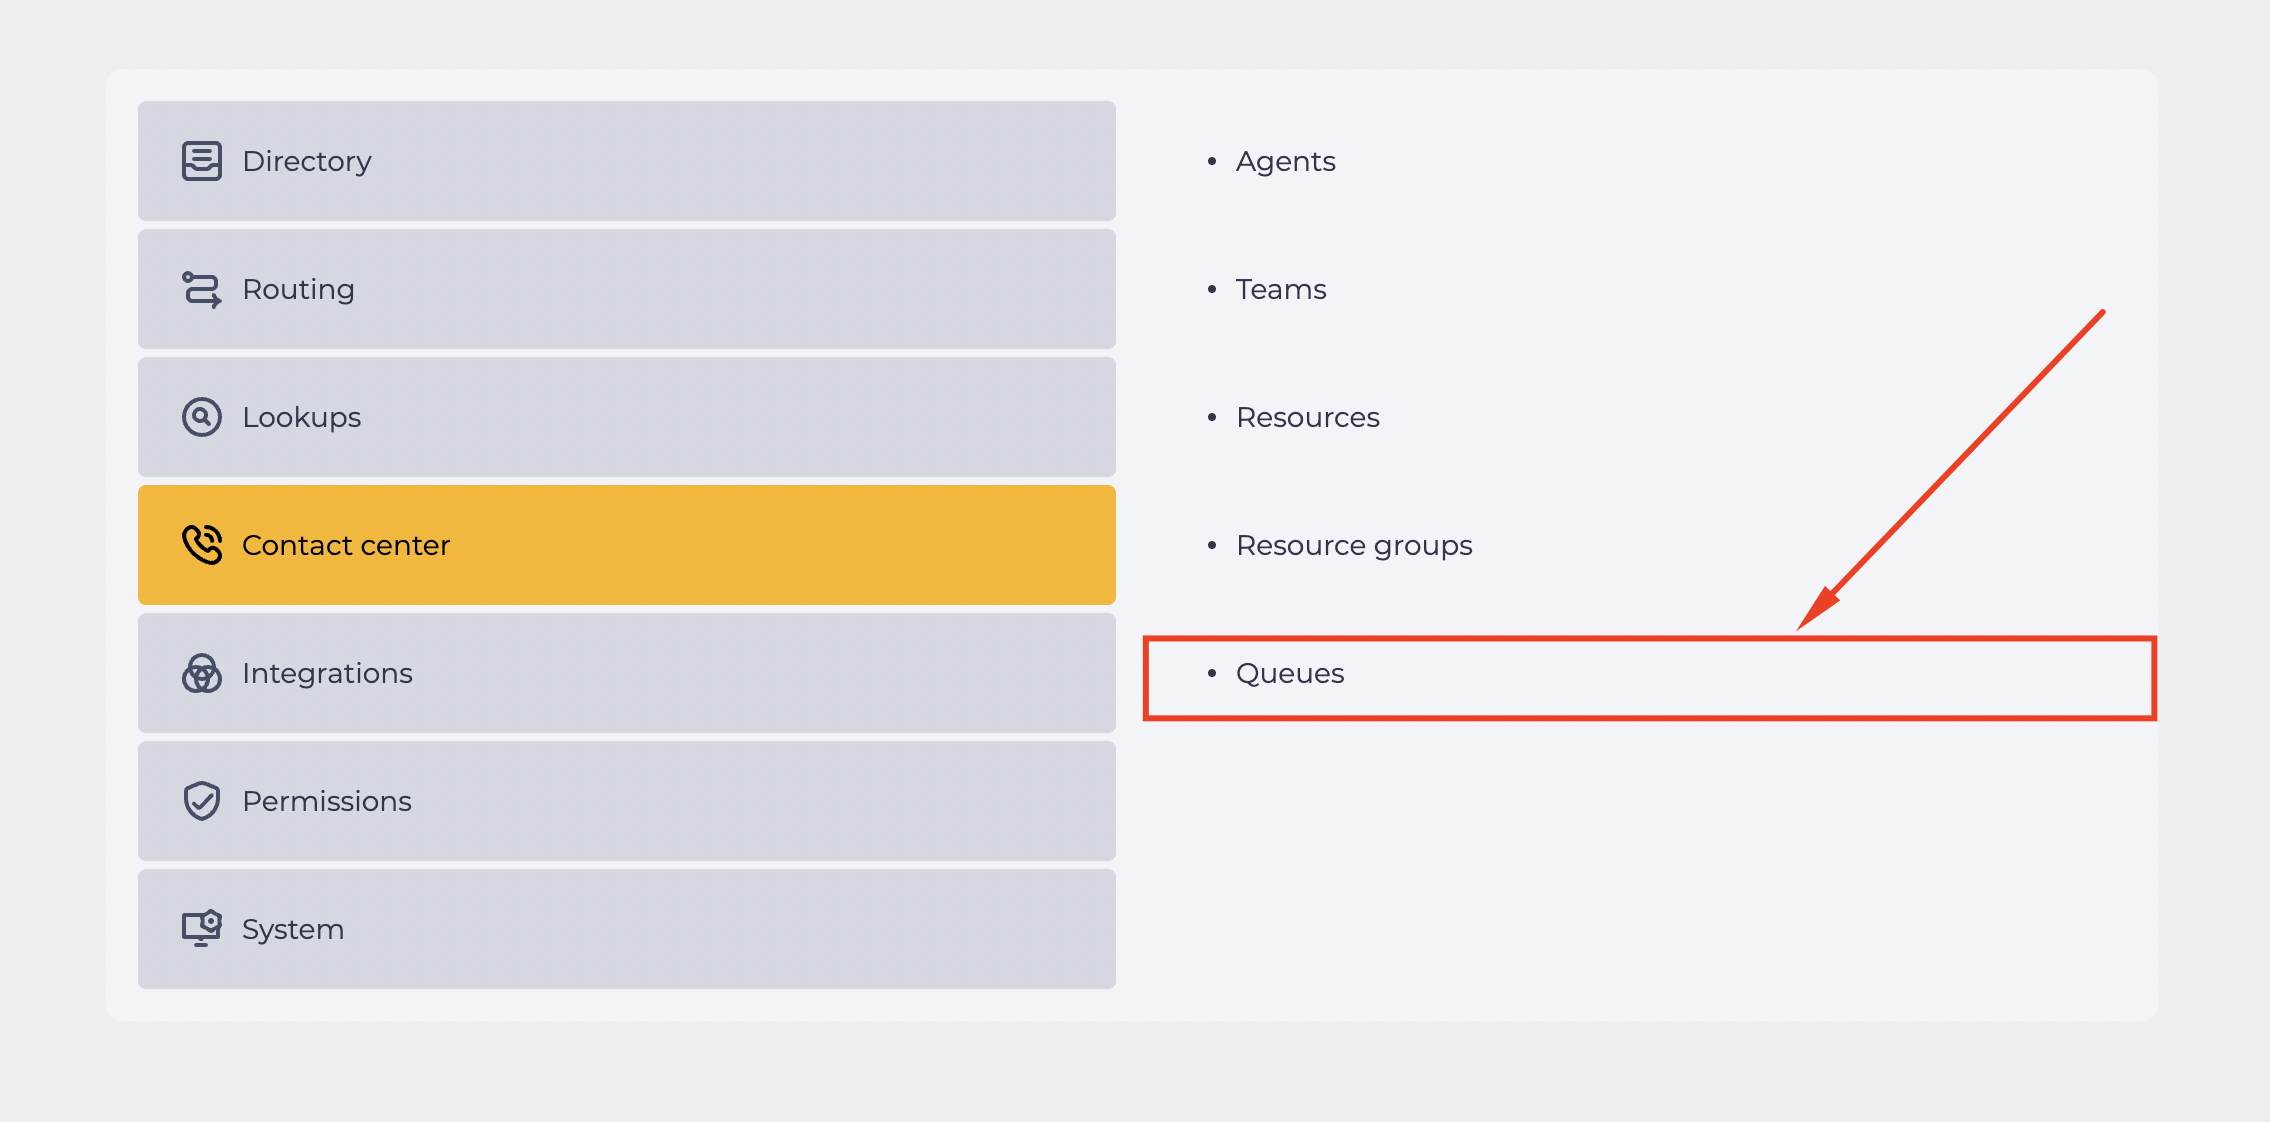
Go to Admin → Contact Center → Queues (Fig. 9).
-
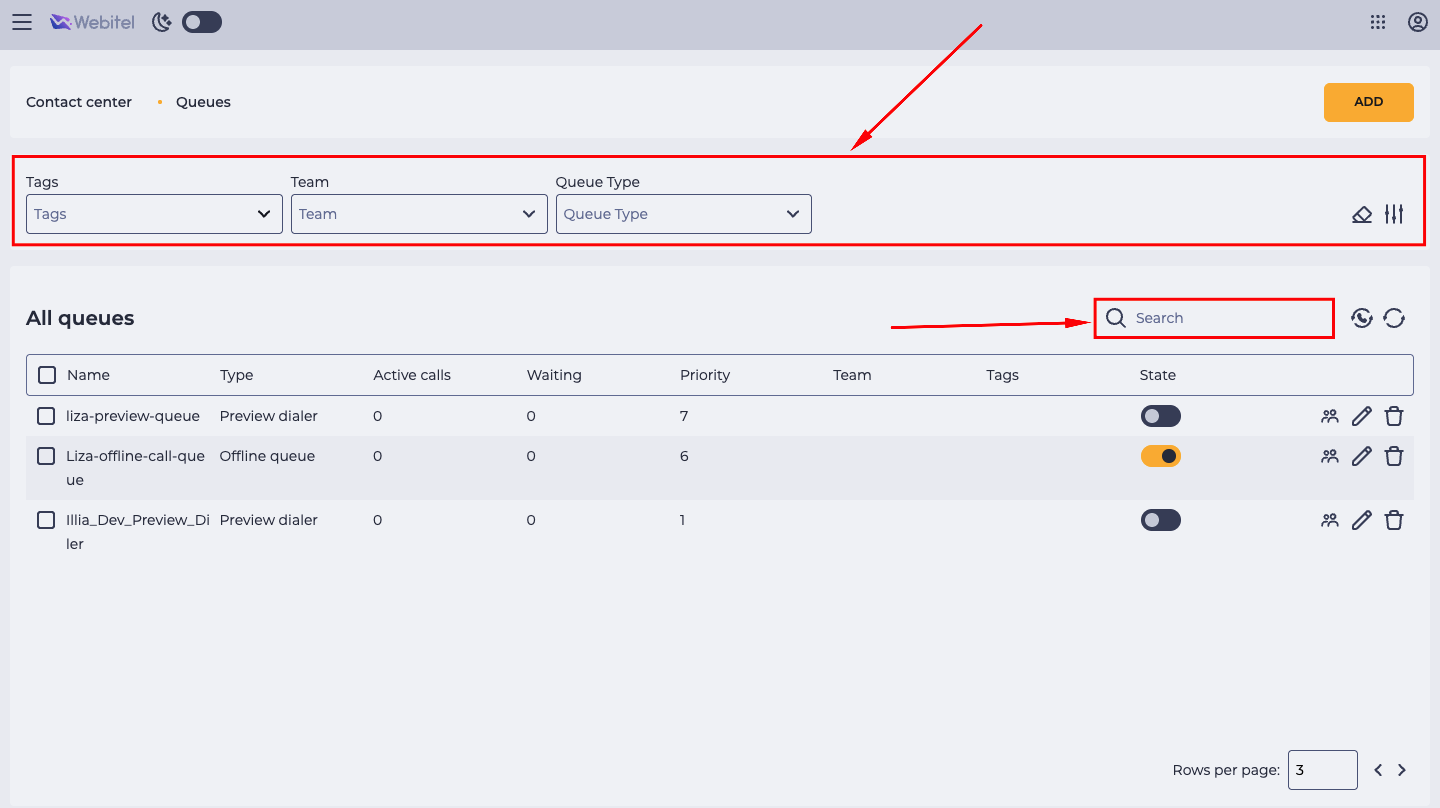
Find the required queue in the registry. You can use filters and/or the search field (Fig. 10).
-
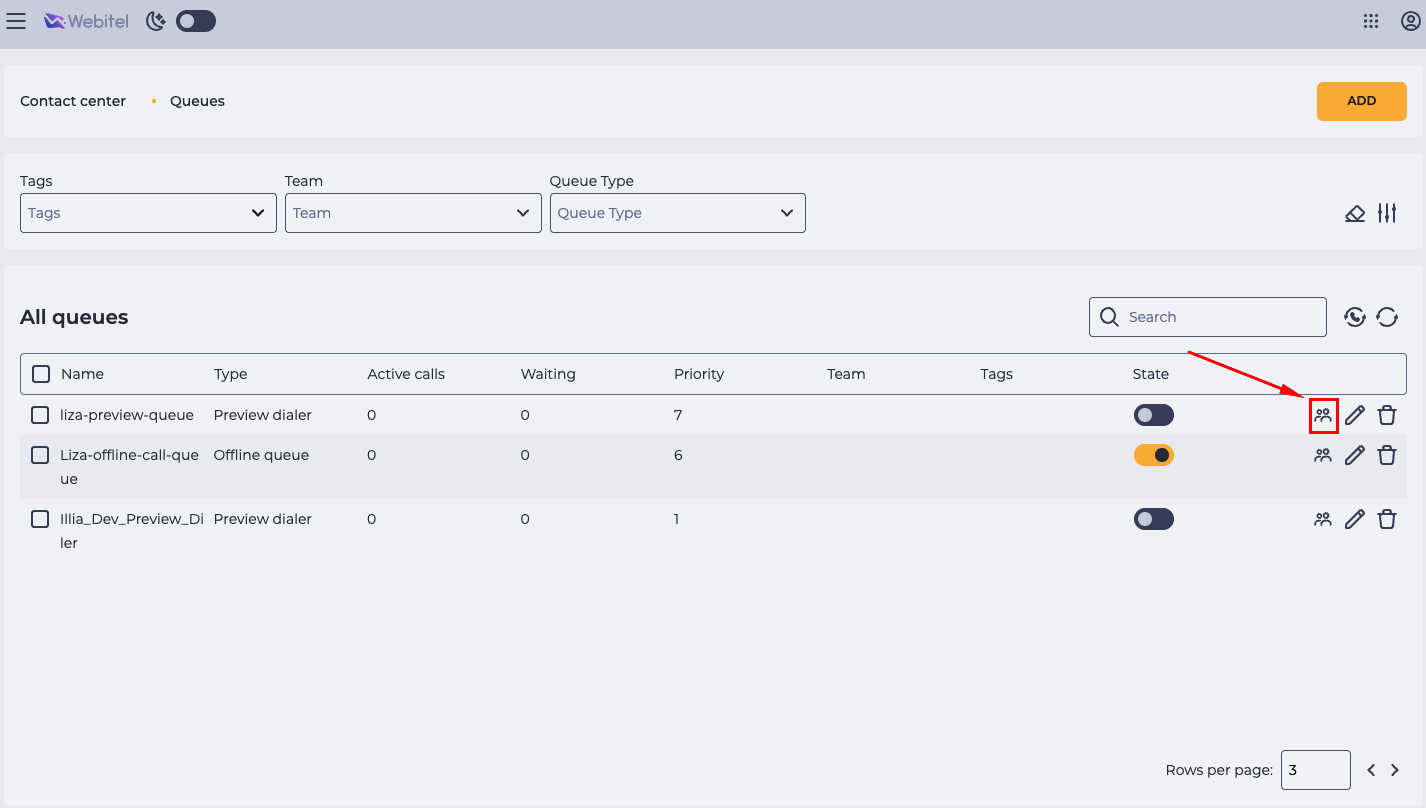
Click the Members tool icon next to the desired queue to open the list of its contacts (Fig. 11).
-
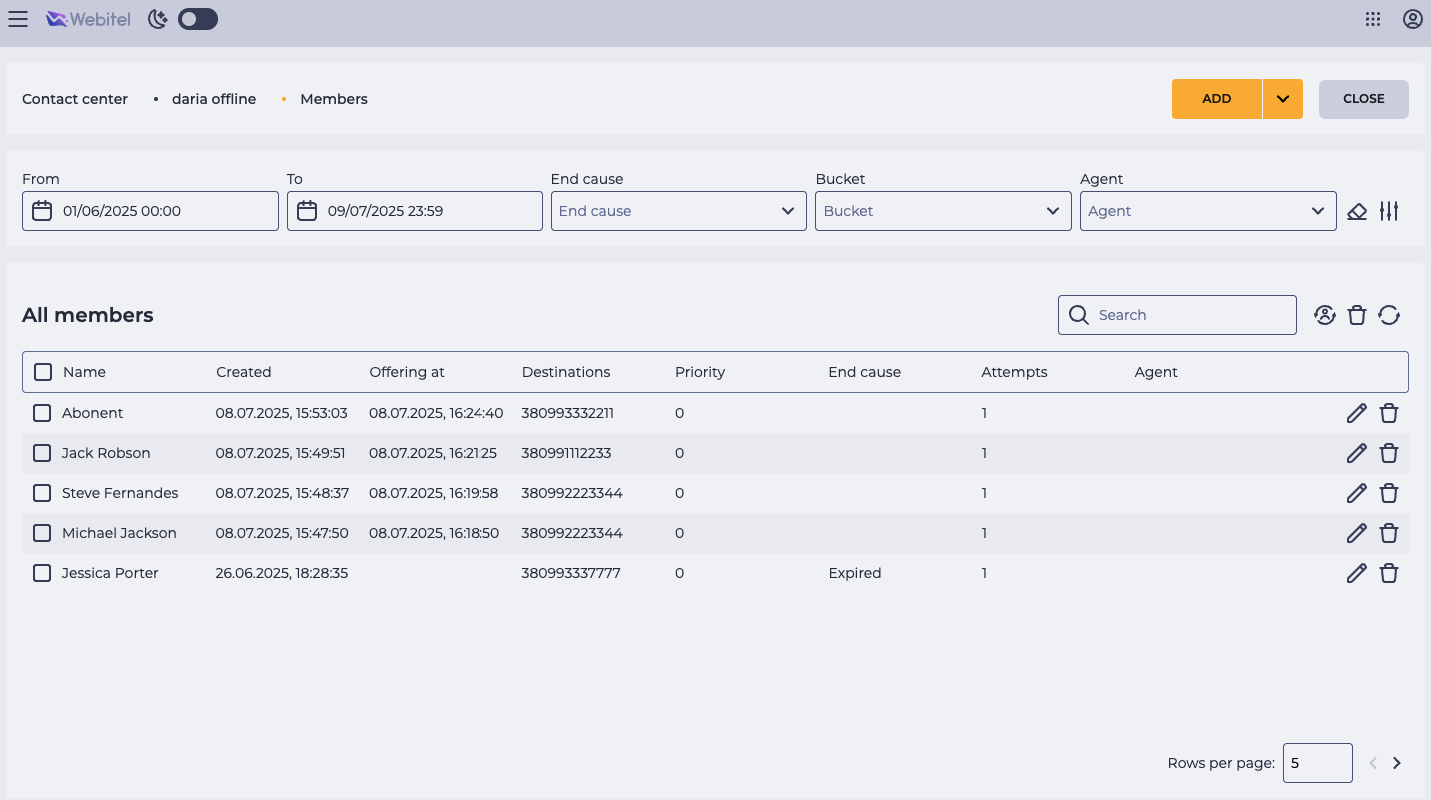
The Members page opens, displaying all current records (Name, Creation Date, Destination, Priority, Attempt count, Completion reason, etc.) (Fig. 12).
-
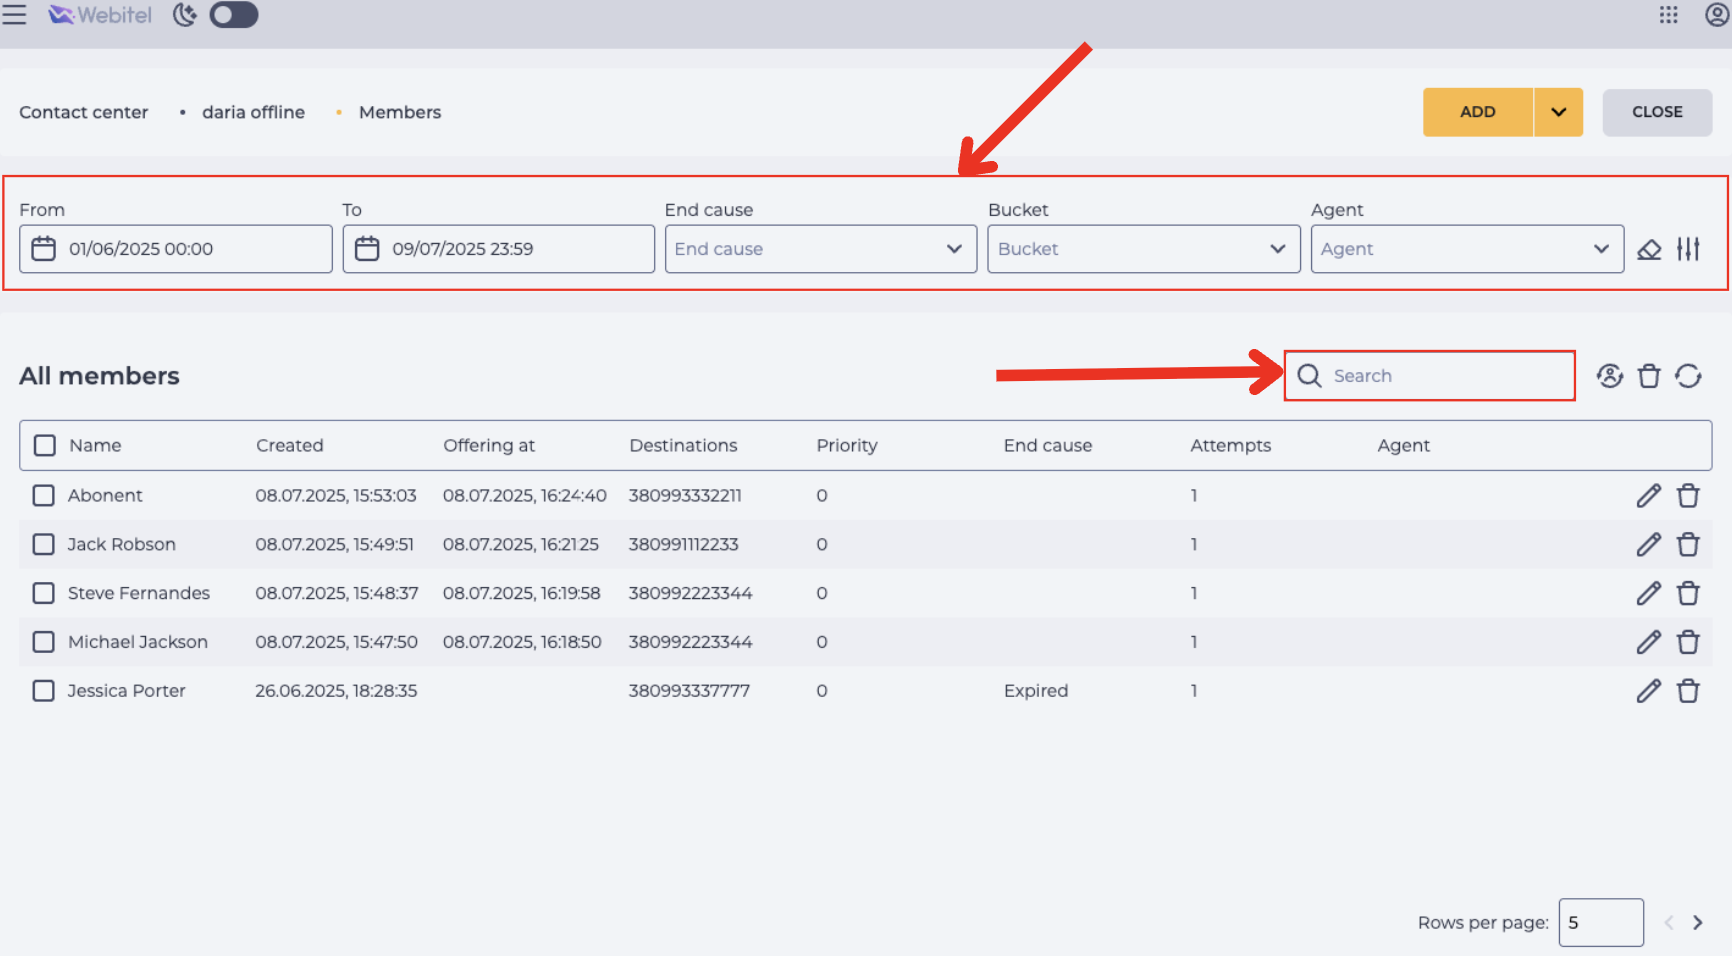
You can apply filters or use the search field to filter by date range, status, priority, or agent (Fig. 13).
-
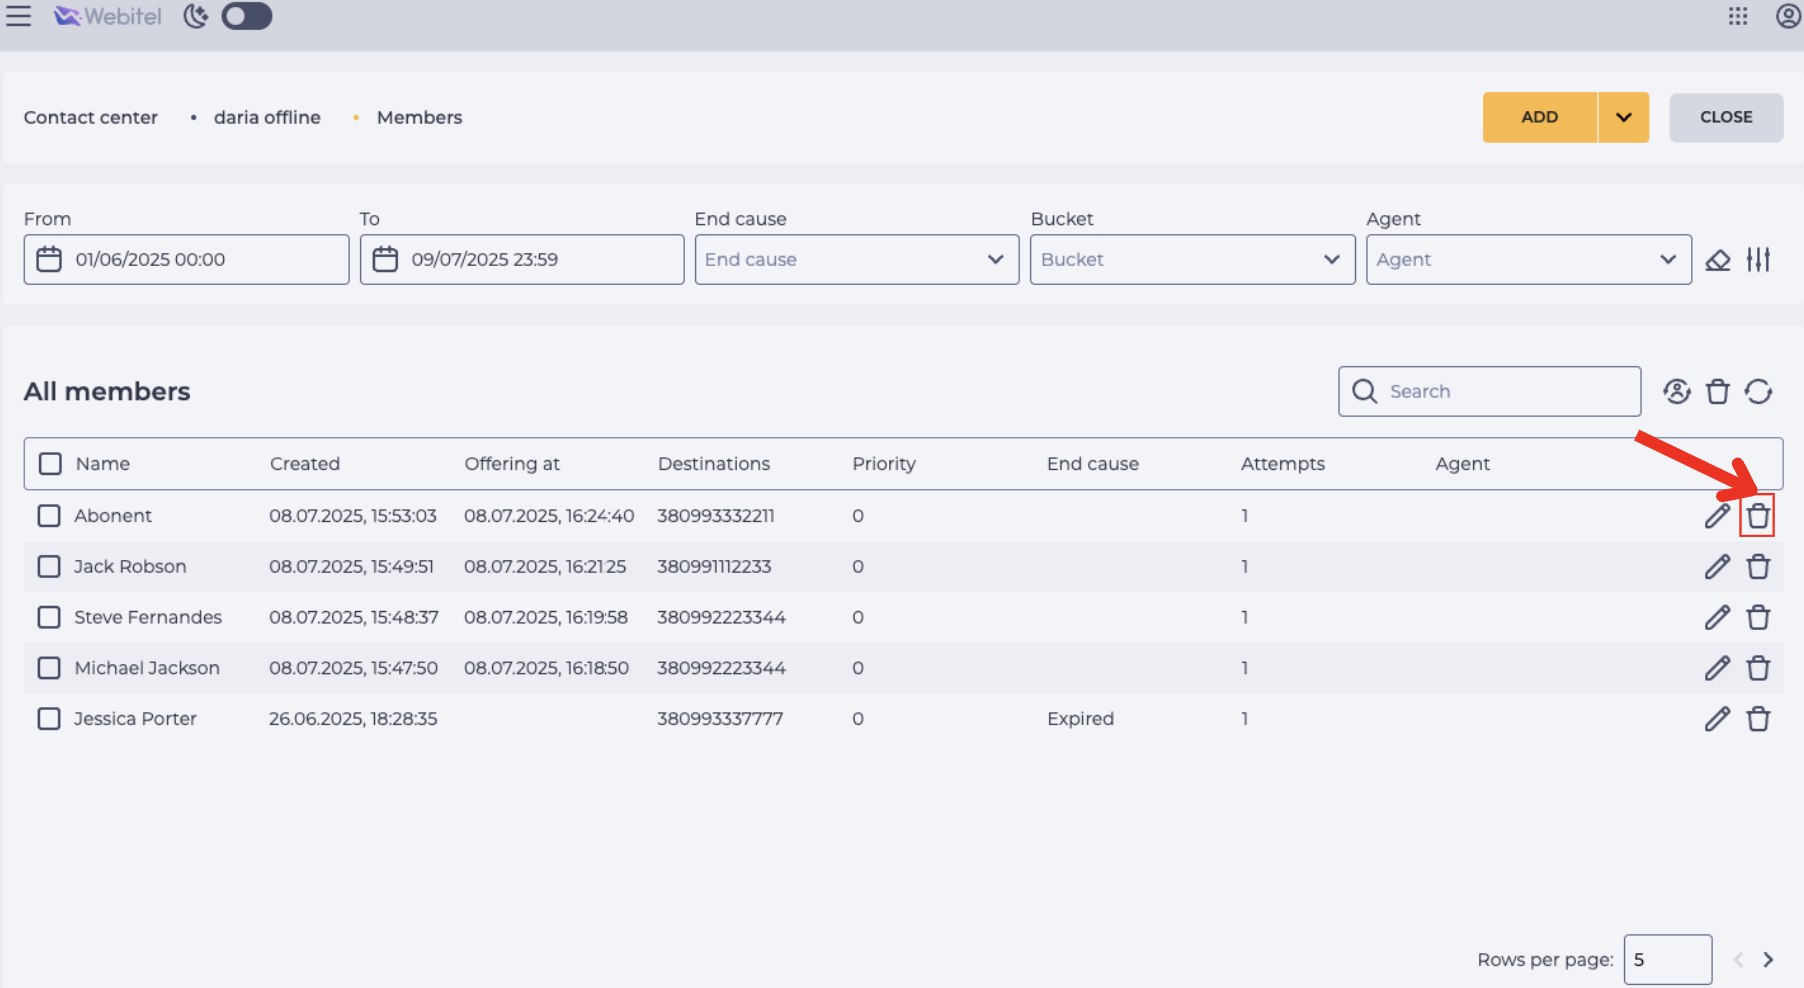
To delete a single Member, click the Removal tool icon next to the corresponding record (Fig. 14).
-
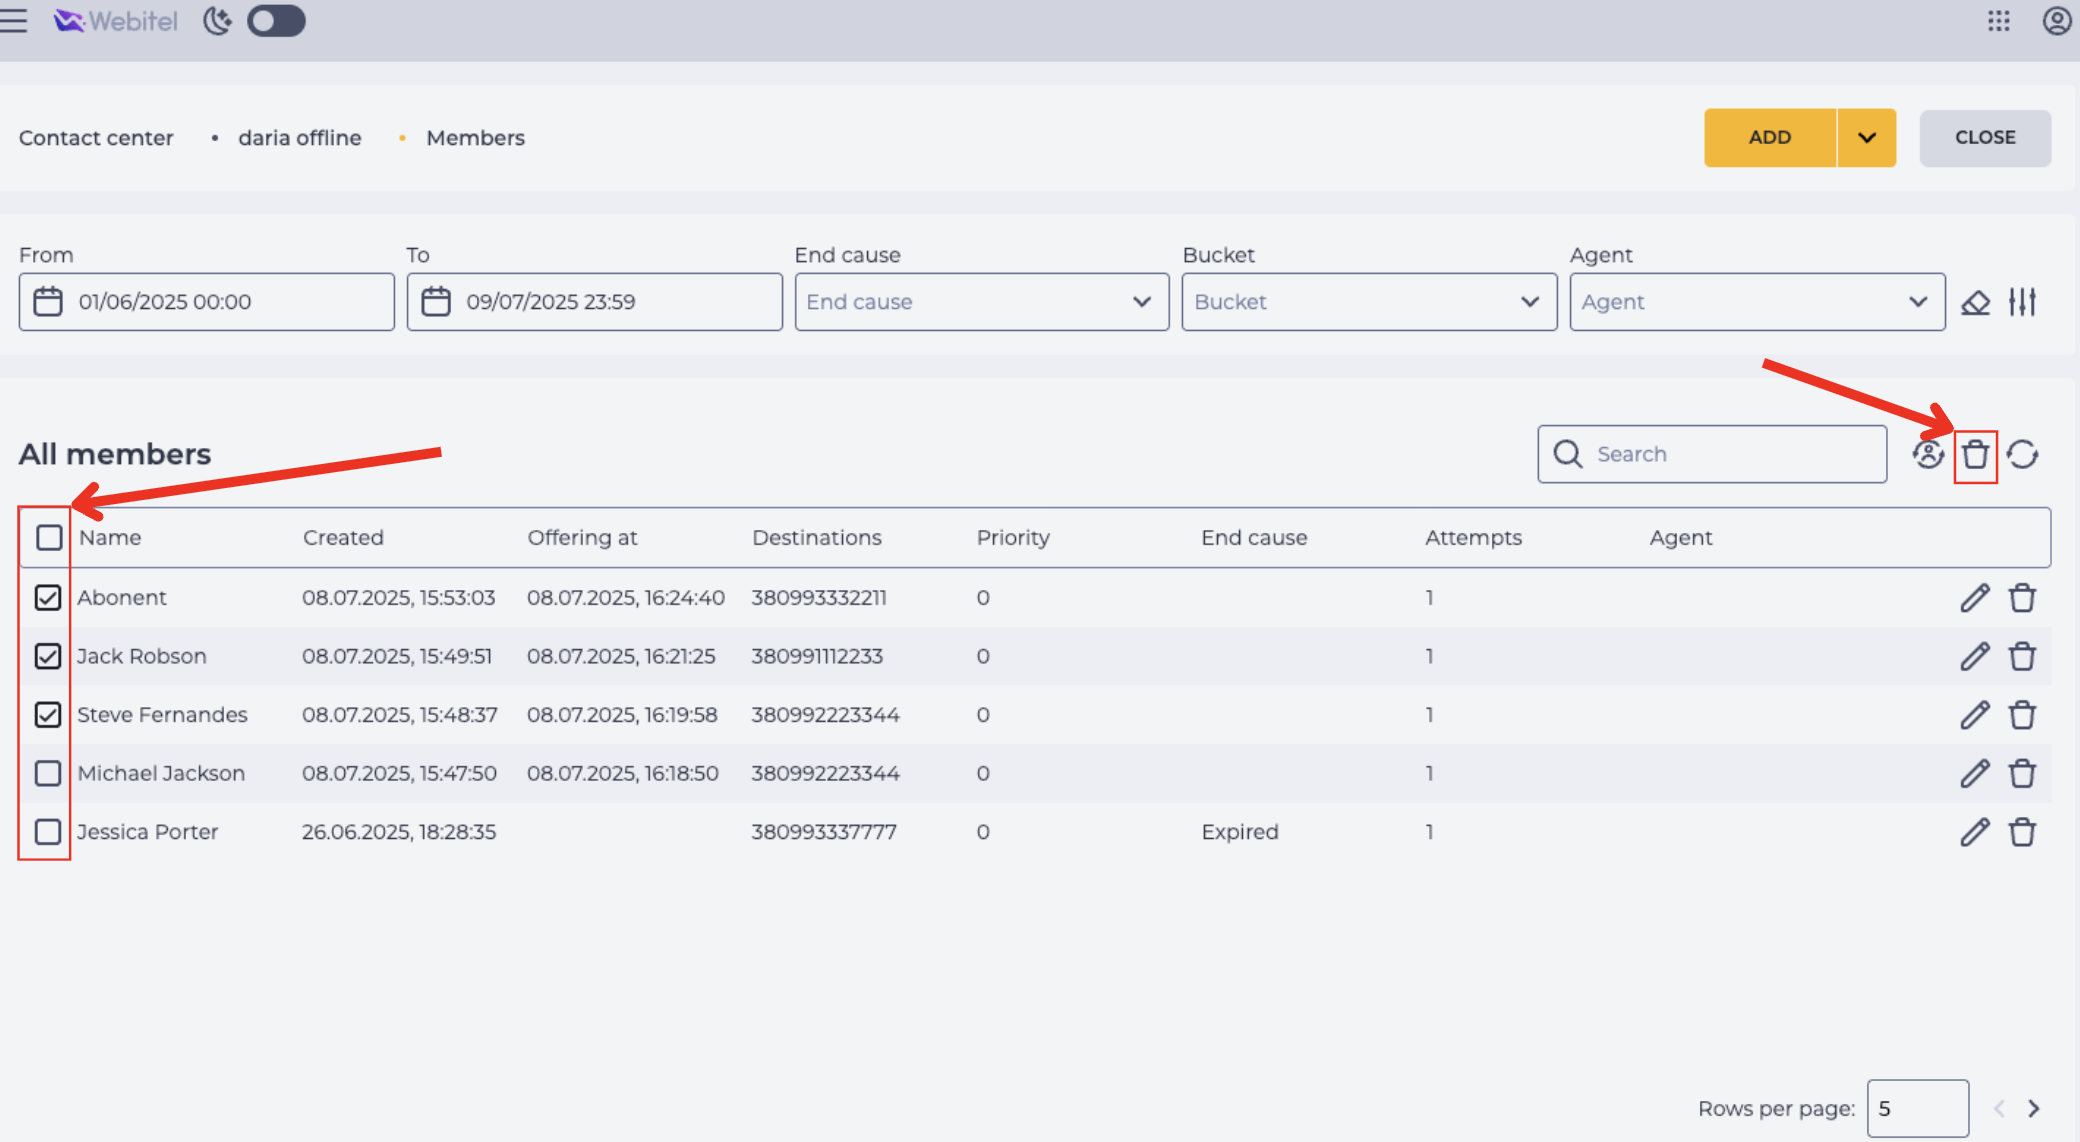
To delete multiple Members, select them using the checkboxes on the left (Fig. 15.(1)) and click the mass deletion icon at the top right of the table (Fig. 15.(2)).
IMPORTANT! Deletion from one queue does not affect other queues — the contact will be removed only from the selected queue.
2.2. Automated Deletion of Contacts via API
If you need to manage the contact list remotely or in bulk, you can use the API to delete queue entries by their IDs.
-
To delete a contact, you need two values: the Queue ID and the Member ID.
-
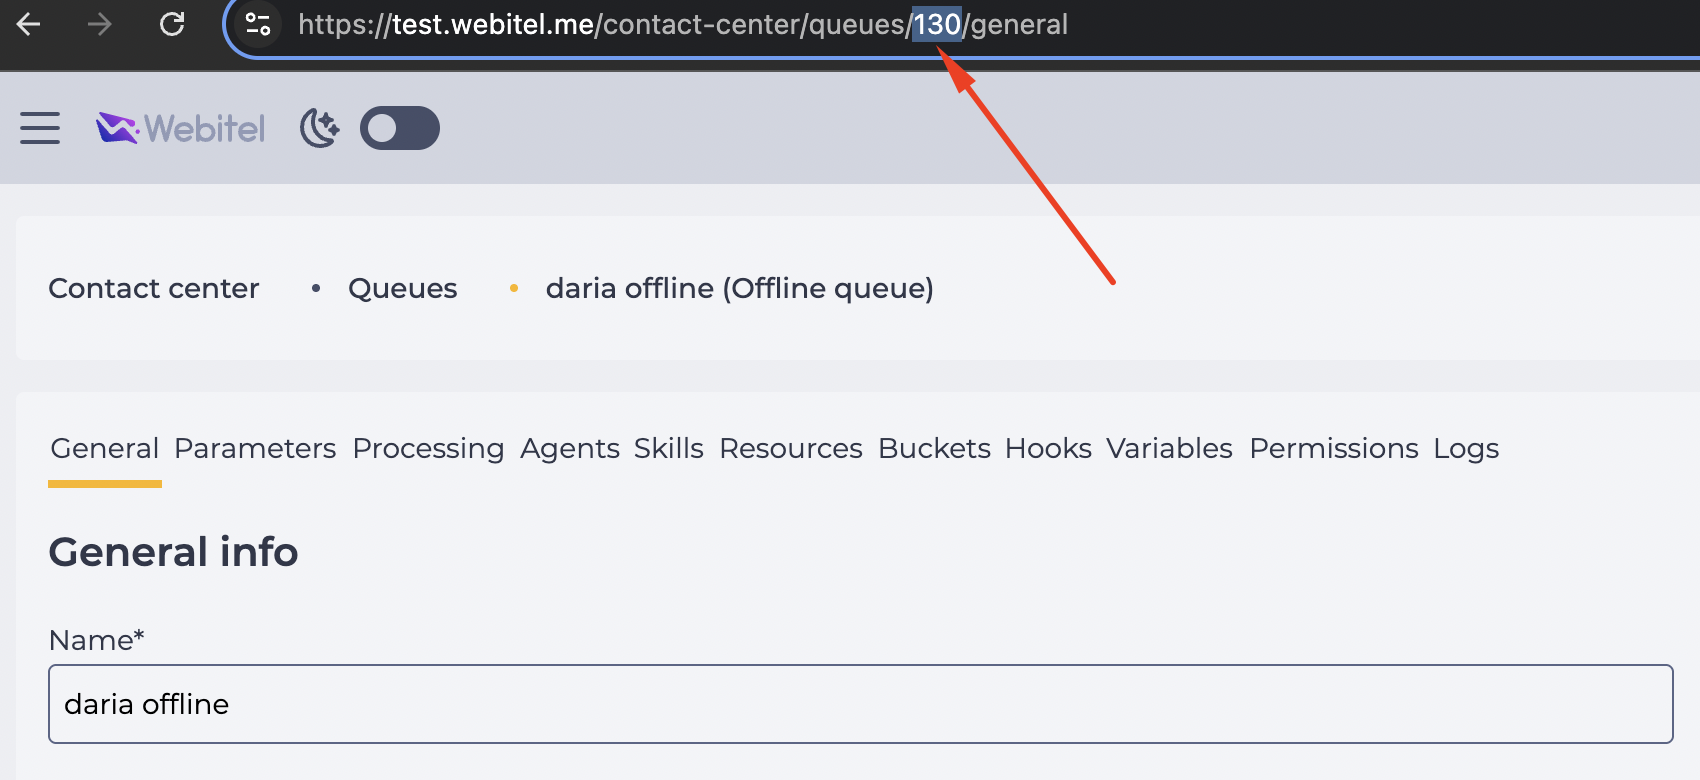
The queue ID can be found in the URL of the queue configuration page: Admin → Contact Center → Queues → (Select a queue) (Fig. 16).
-
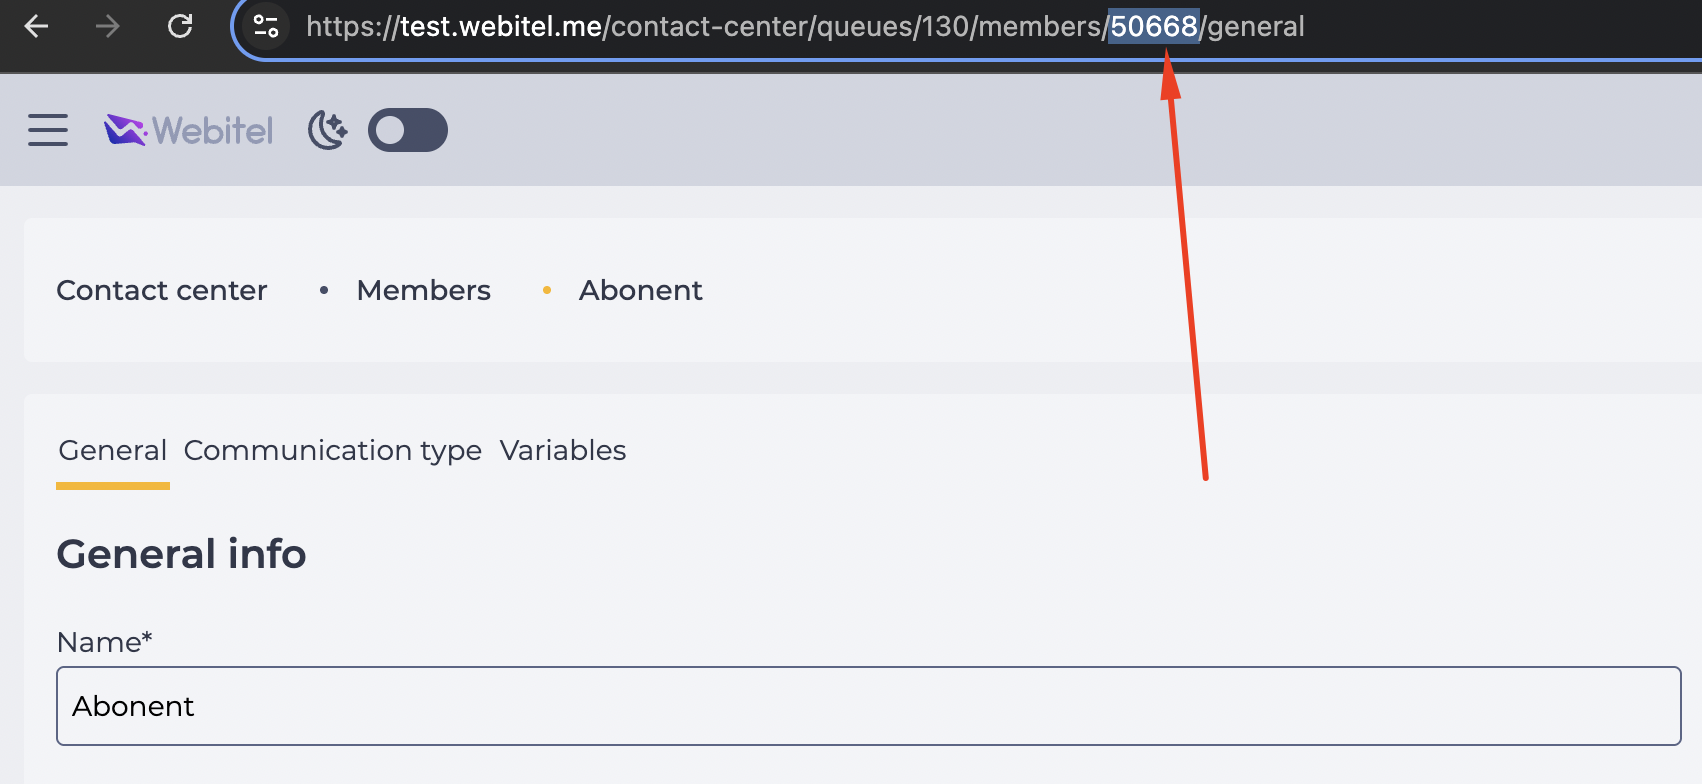
The Member ID can be found in the URL of the specific contact’s edit page: Admin → Contact Center → Queues → Members → (Select a contact) (Fig. 17).
-
Once you have both the Queue ID and Member ID, you can perform the deletion via API using the
DELETEmethod:
DELETE /call_center/queues/{queue_id}/members/{id}
For example, to delete a contact with ID 50668 from a queue with ID 130, the request would look like this:
DELETE /call_center/queues/130/members/50668
2.2.1. Steps to Execute the Request in Postman
IMPORTANT!
Before sending the request, make sure that:
-
You have a valid license key;
-
Your account has sufficient access rights to use the Webitel API;
-
You have entered the correct
queue_idand contactid.
-
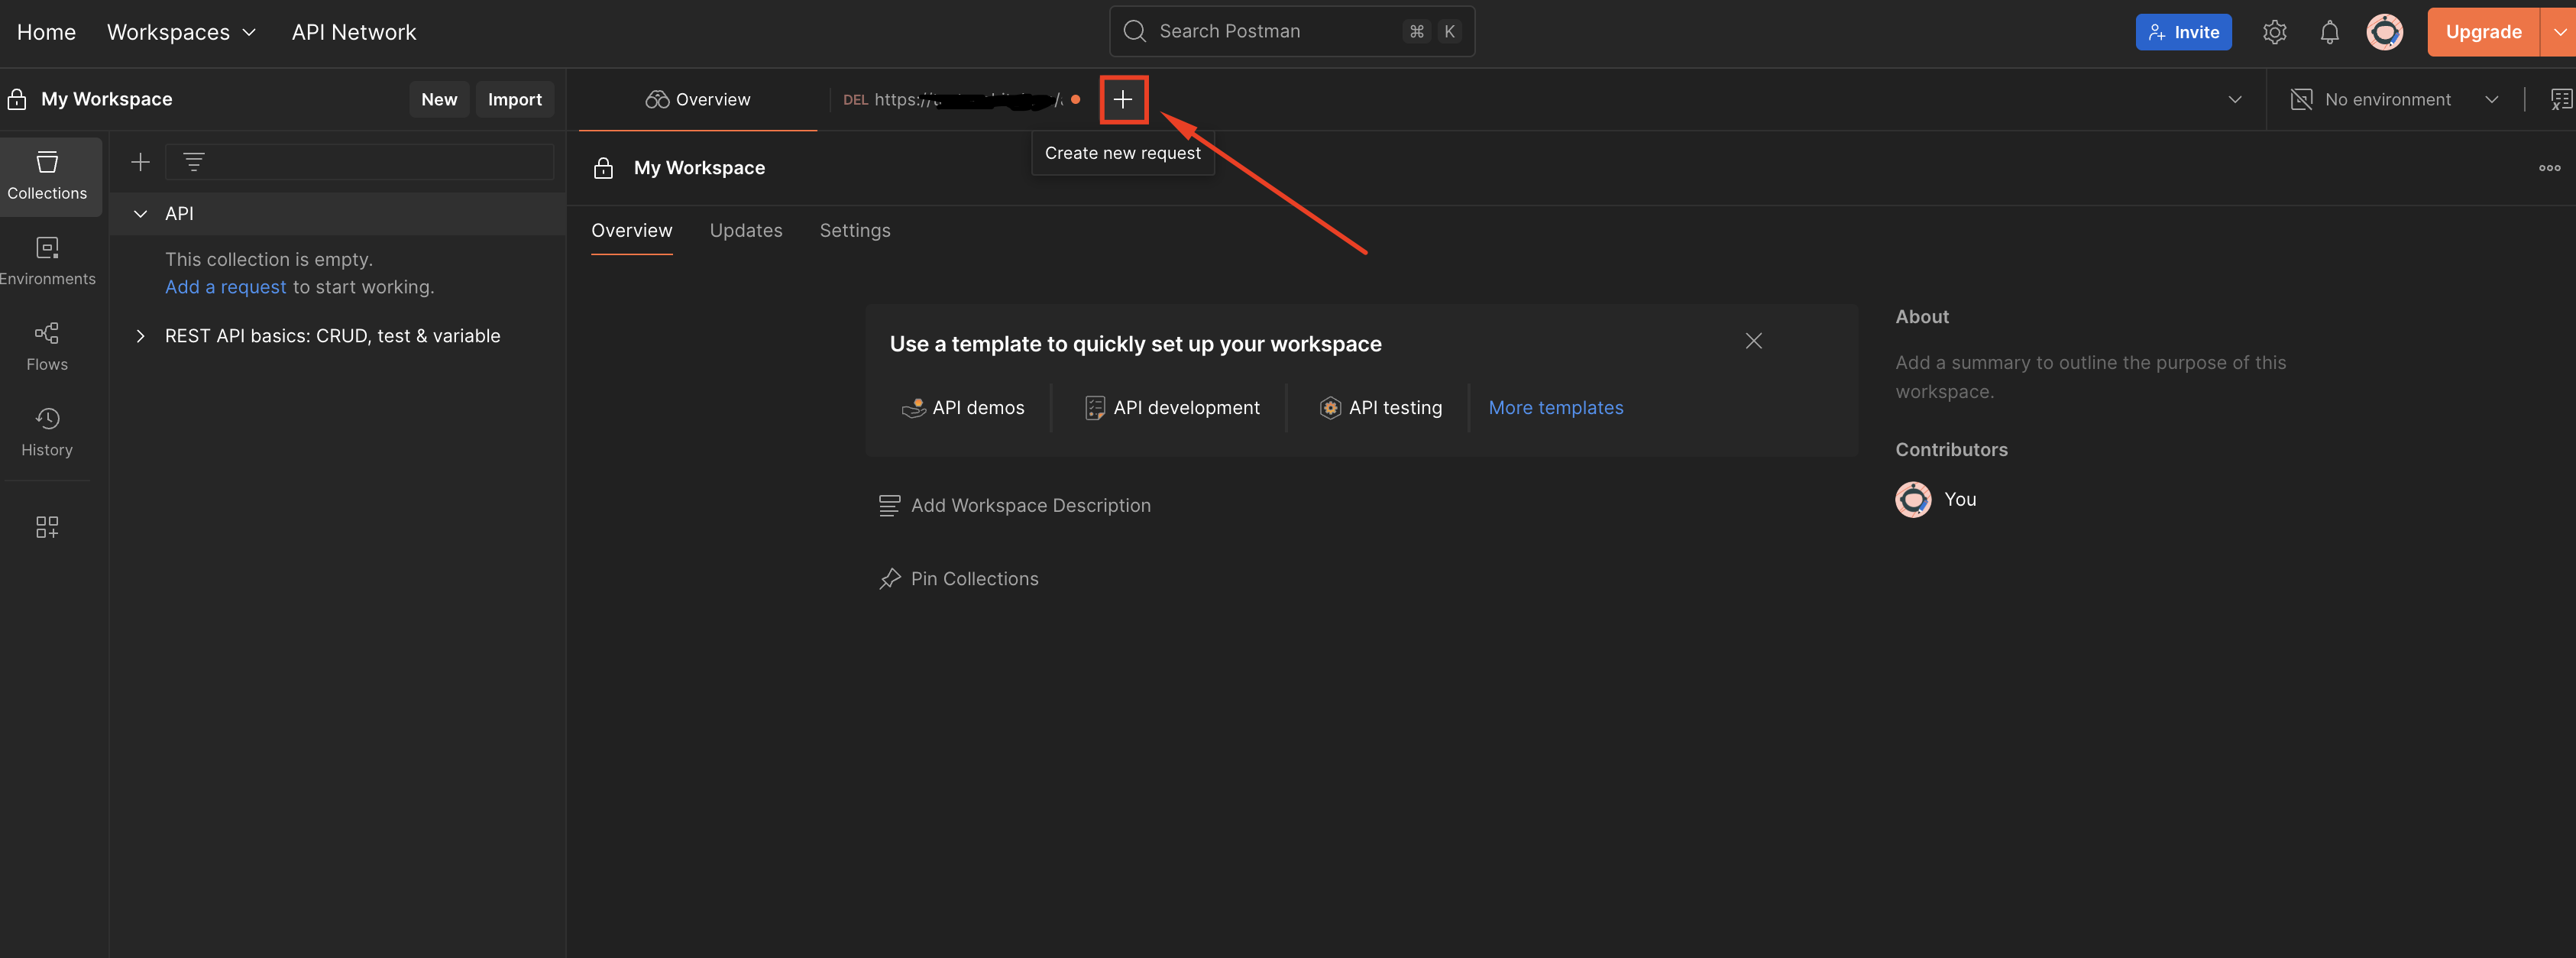
Open Postman and click the + button to create a new request (Fig. 18).
-
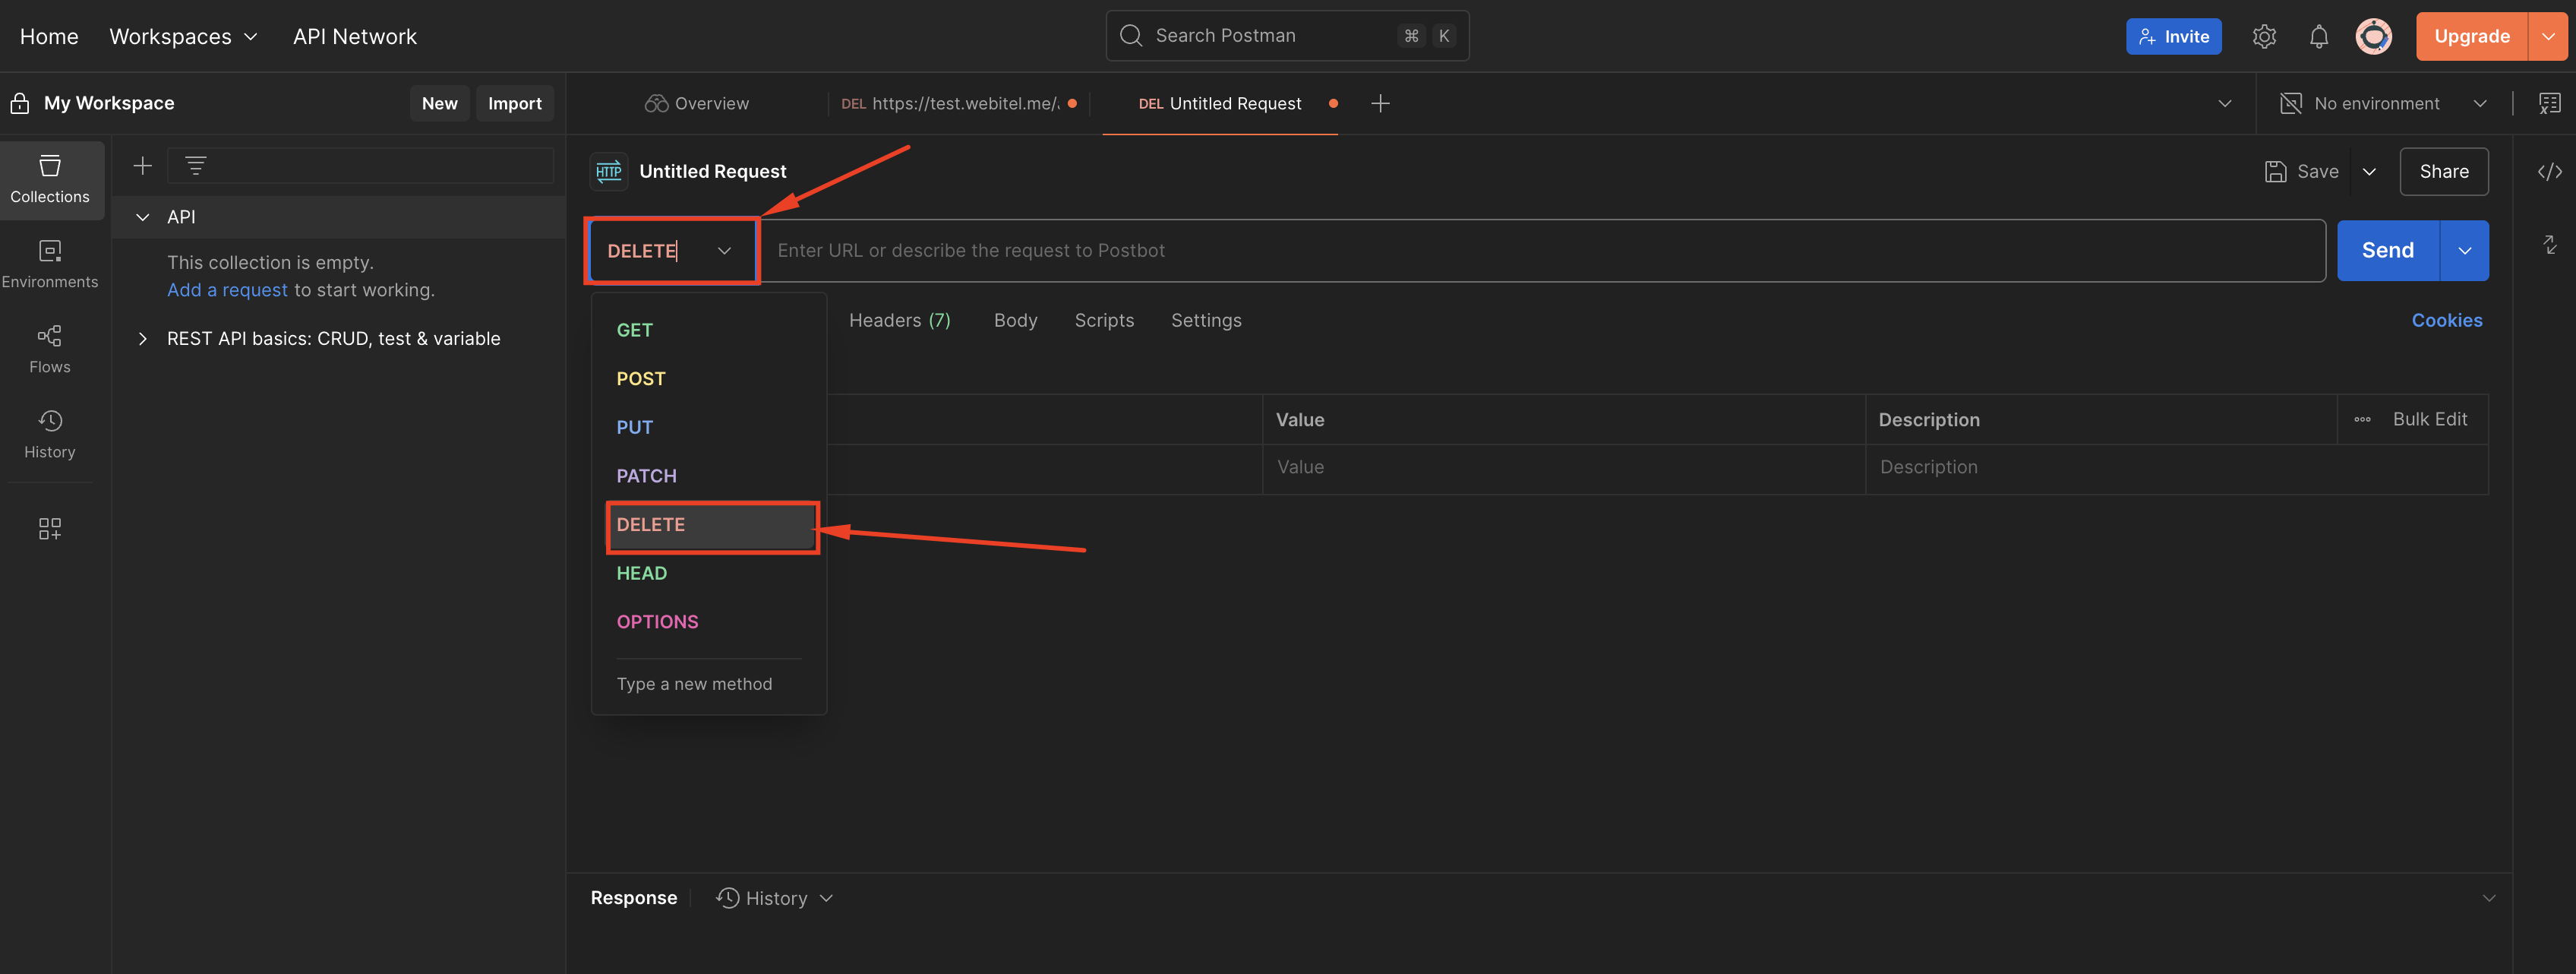
In the left dropdown, select the DELETE method (Fig. 19).
-
Enter the full request URL in the following format:
https://{your_domain}/api/call_center/queues/{queue_id}/members/{id}
-
https://{your_domain} — base address of your Webitel instance (e.g., test.webitel);
-
/api/call_center/queues/ — path to the call center queues;
-
{queue_id} — unique ID of the queue from which you want to delete the contact (e.g., 130);
-
{id} — unique ID of the contact you want to delete (e.g., 50668).
-
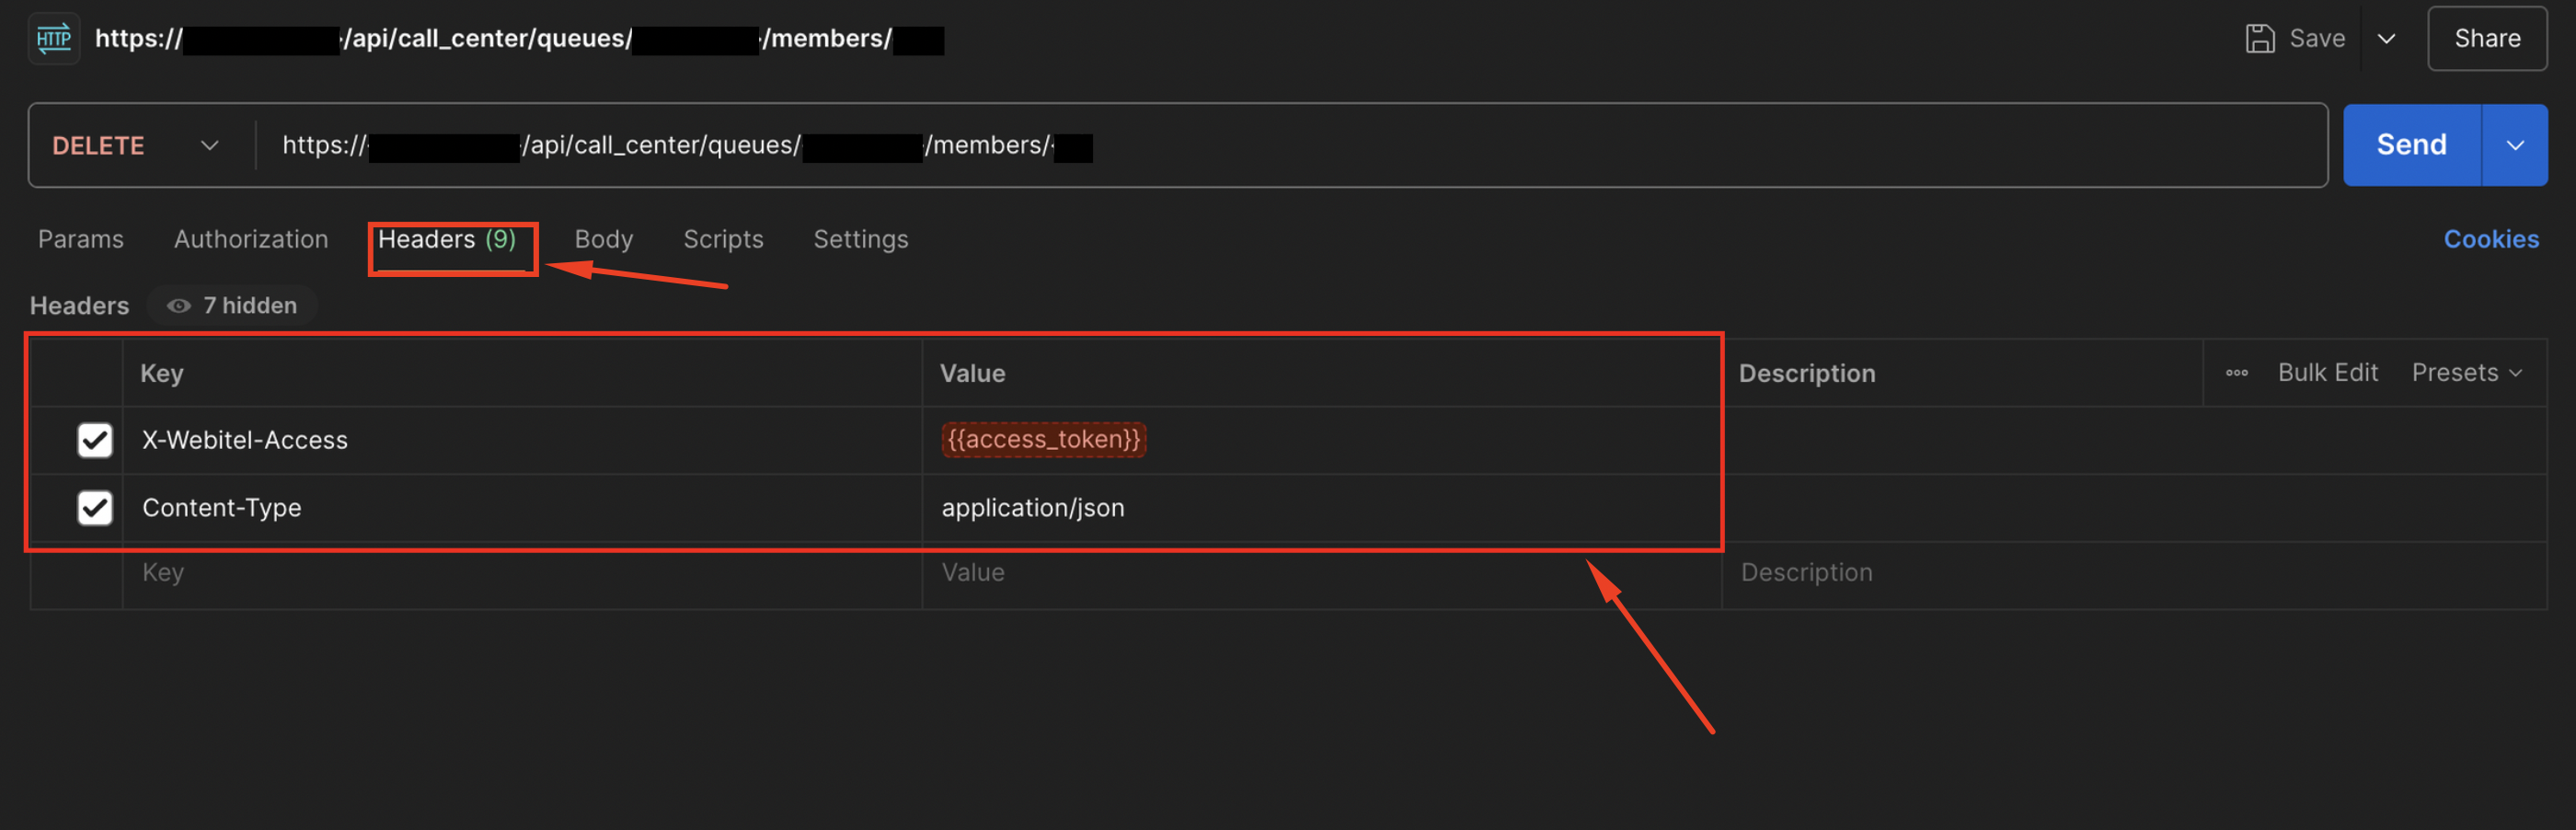
Open the Headers tab (Fig. 20) and add the following key-value pairs:
|
Key |
Value |
|---|---|
|
X-Webitel-Access |
{{access_token}}* |
|
Content-Type |
application/json |
*The access token is generated in the user settings. Example: eyJhbGciOiJIUzI1NiIsInR5cCI6IkpXVCJ9...
-
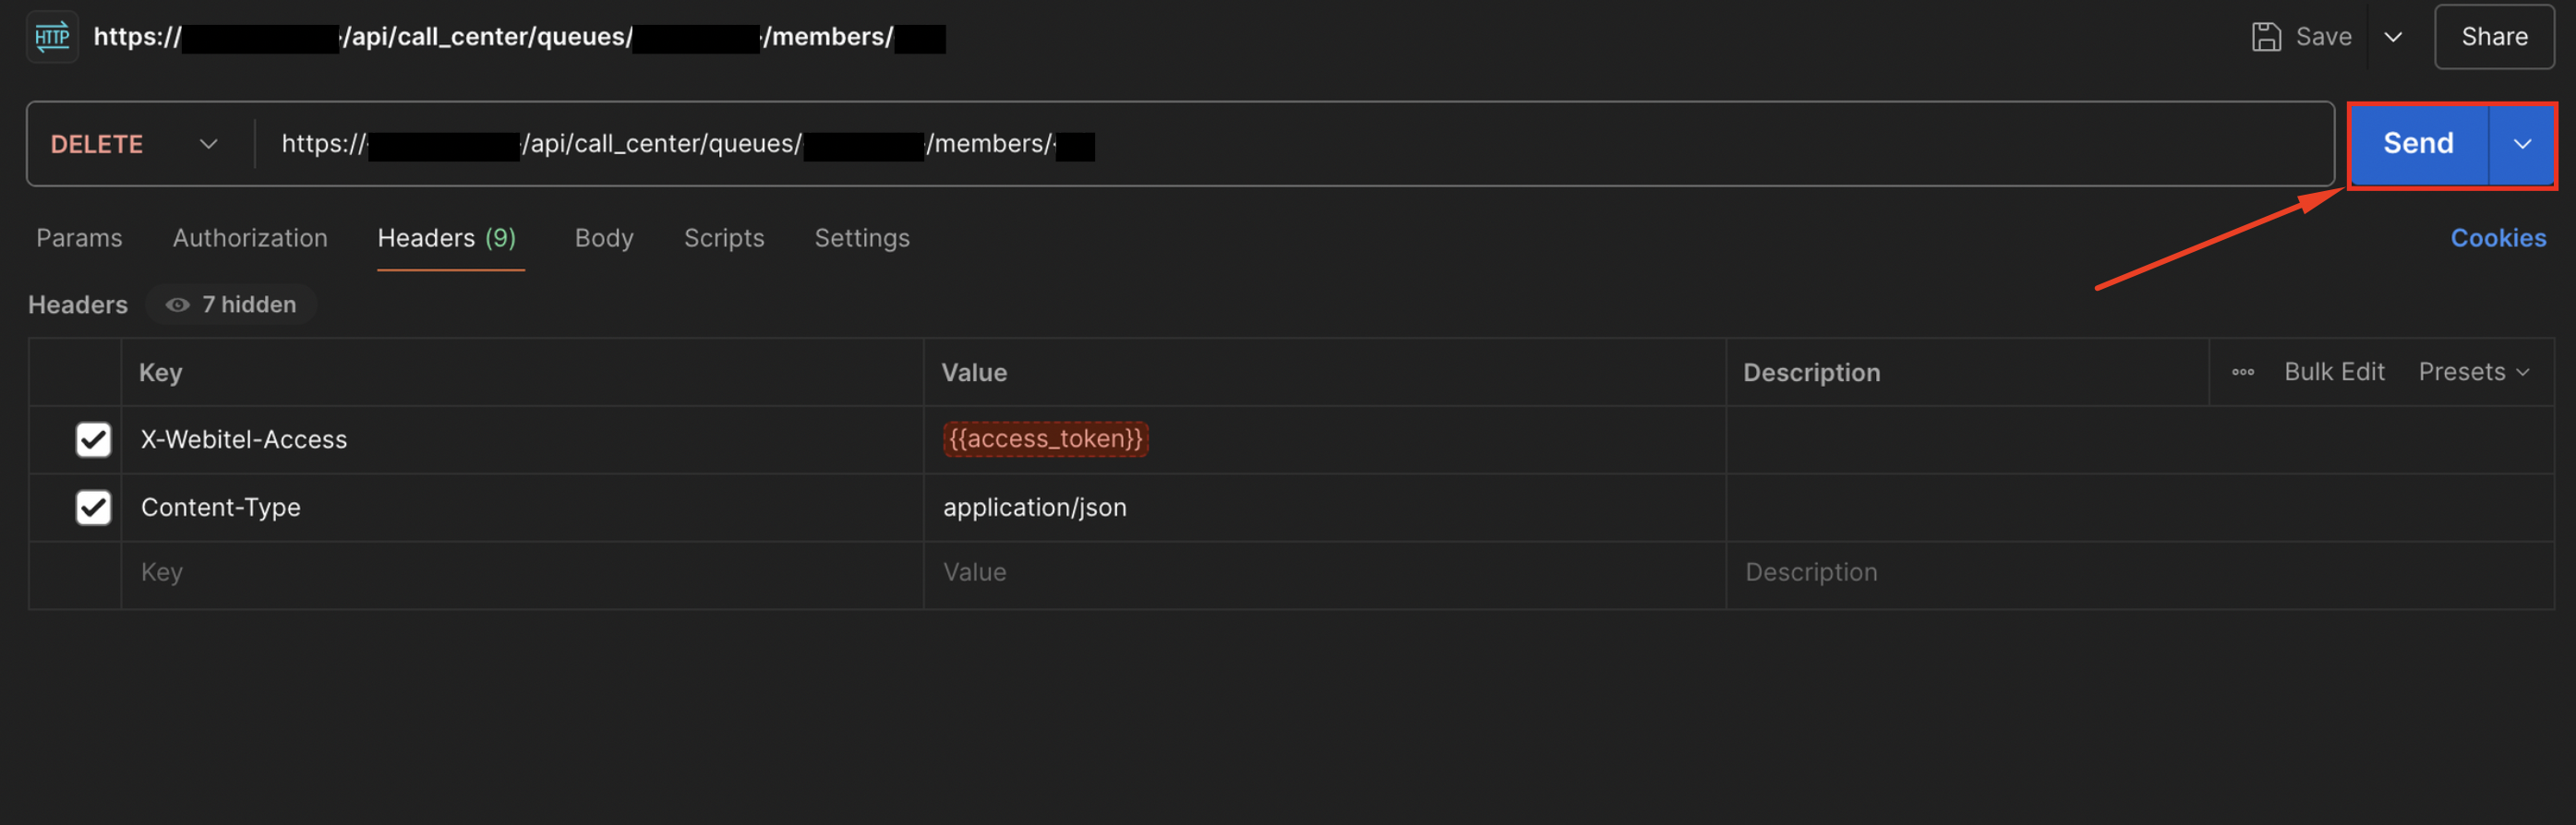
Click the Send button to submit the request (Fig. 21).
-
If the request is successful, the server will return a 200 OK HTTP status, indicating that the contact has been successfully deleted.
Note: Deletion via API has the same effect as manual deletion — the contact is removed only from the selected queue. Other queues remain unchanged.
2.3. Deletion Restrictions
-
Contacts added manually (via the interface): can be deleted without limitations.
-
Contacts imported via CSV: can be deleted manually or via API.
-
Active calls: if the contact is currently in a call, they cannot be deleted until the call is finished.
-
Contacts in wrap-up state: deletion may be delayed until the wrap-up is completed.
3. Configuring display of text and variables in the Post-processing form
To immediately display text and variables to the agent after the call ends:
-
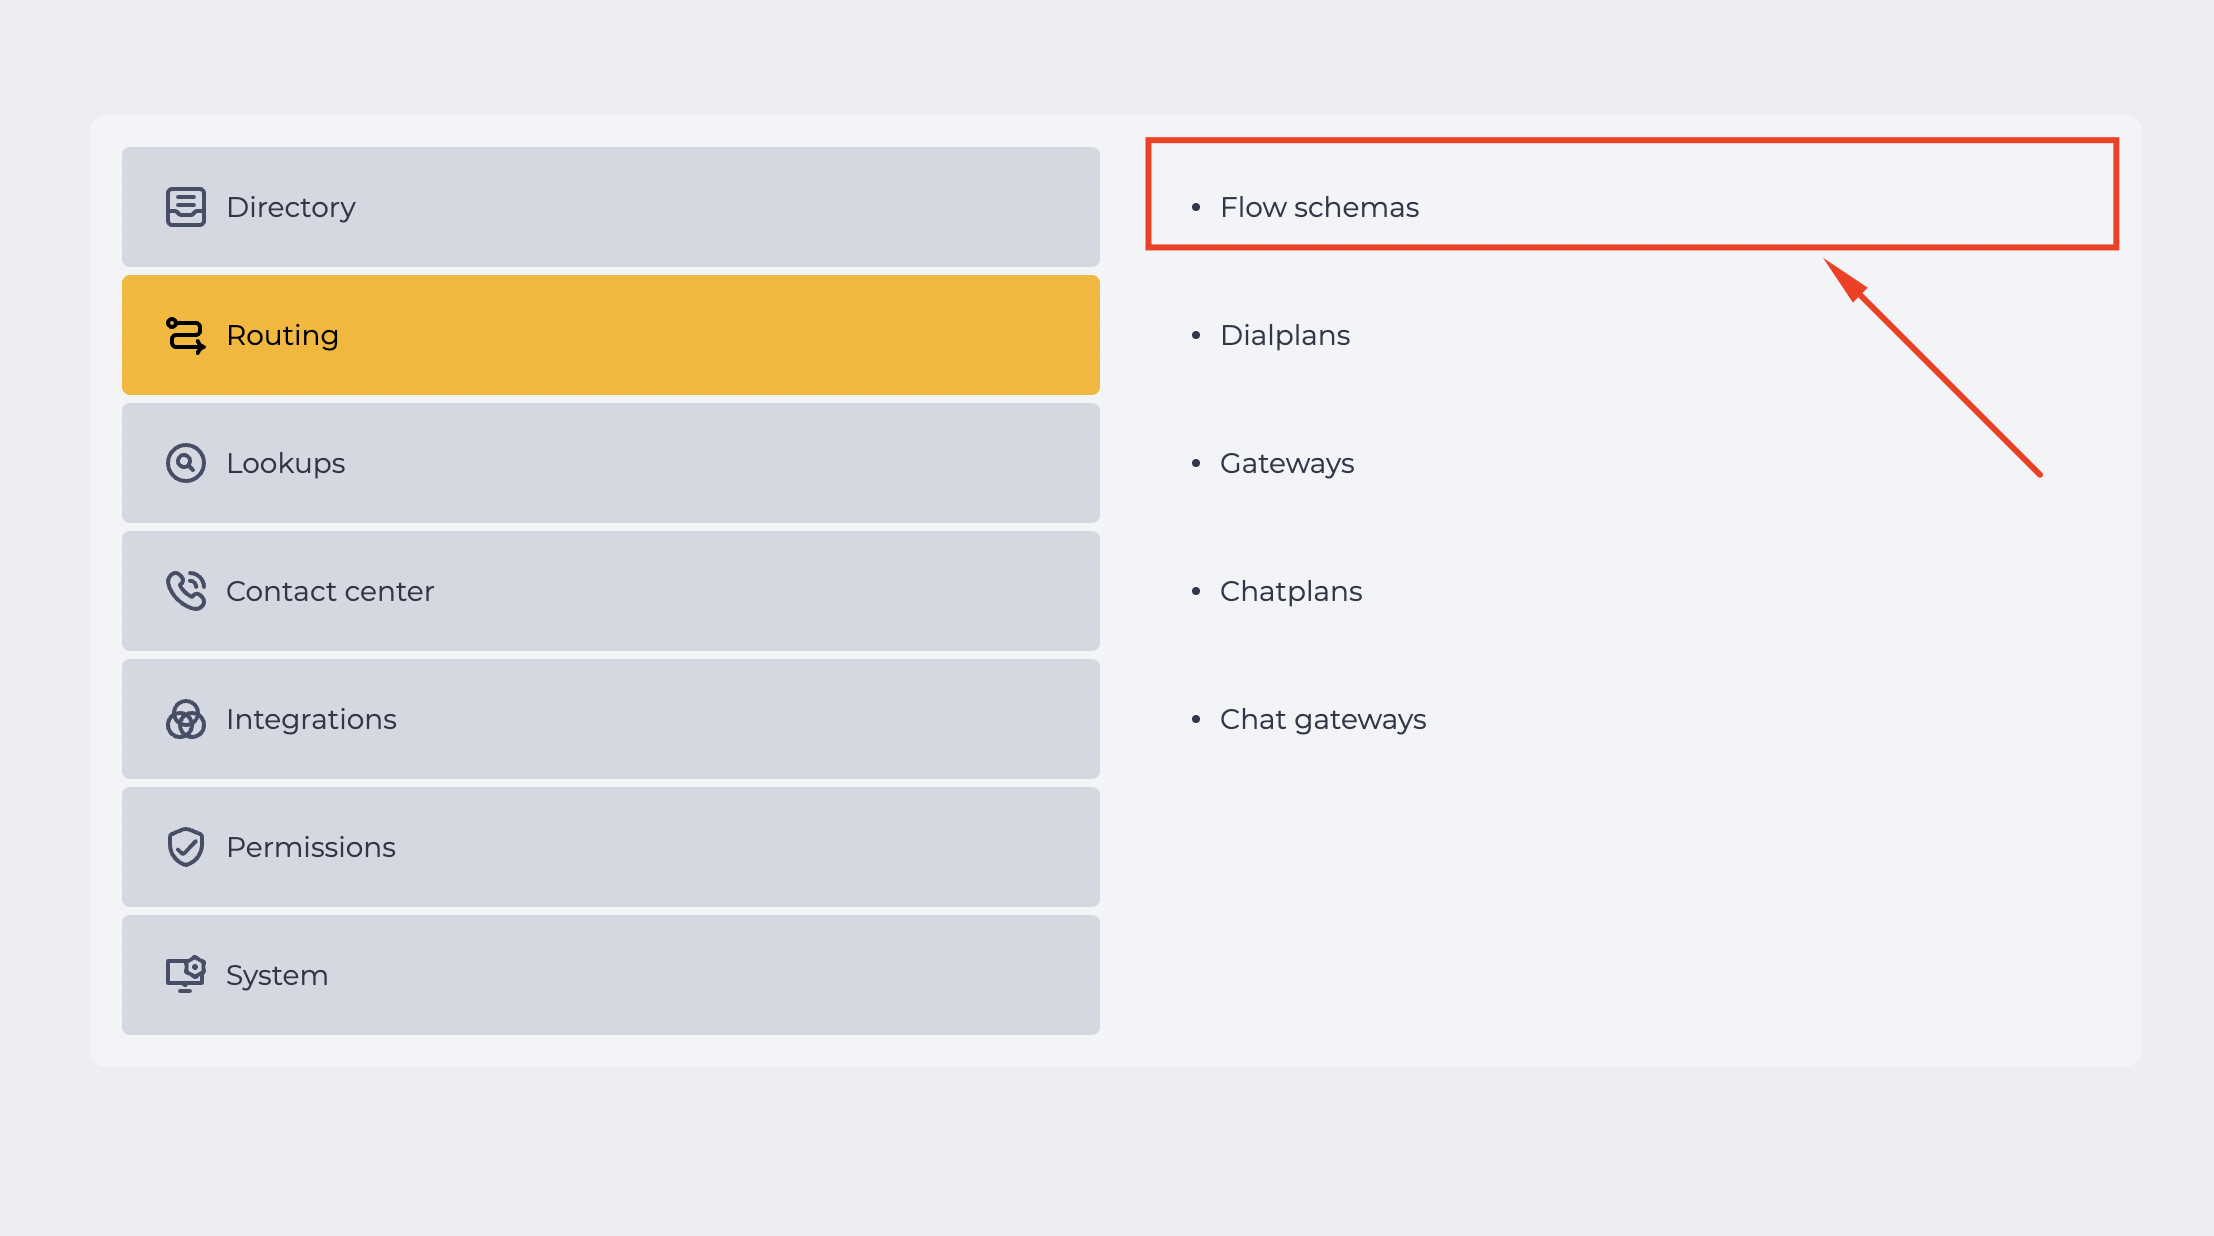
Go to Admin → Routing → Flow schemas (Fig. 22).
-
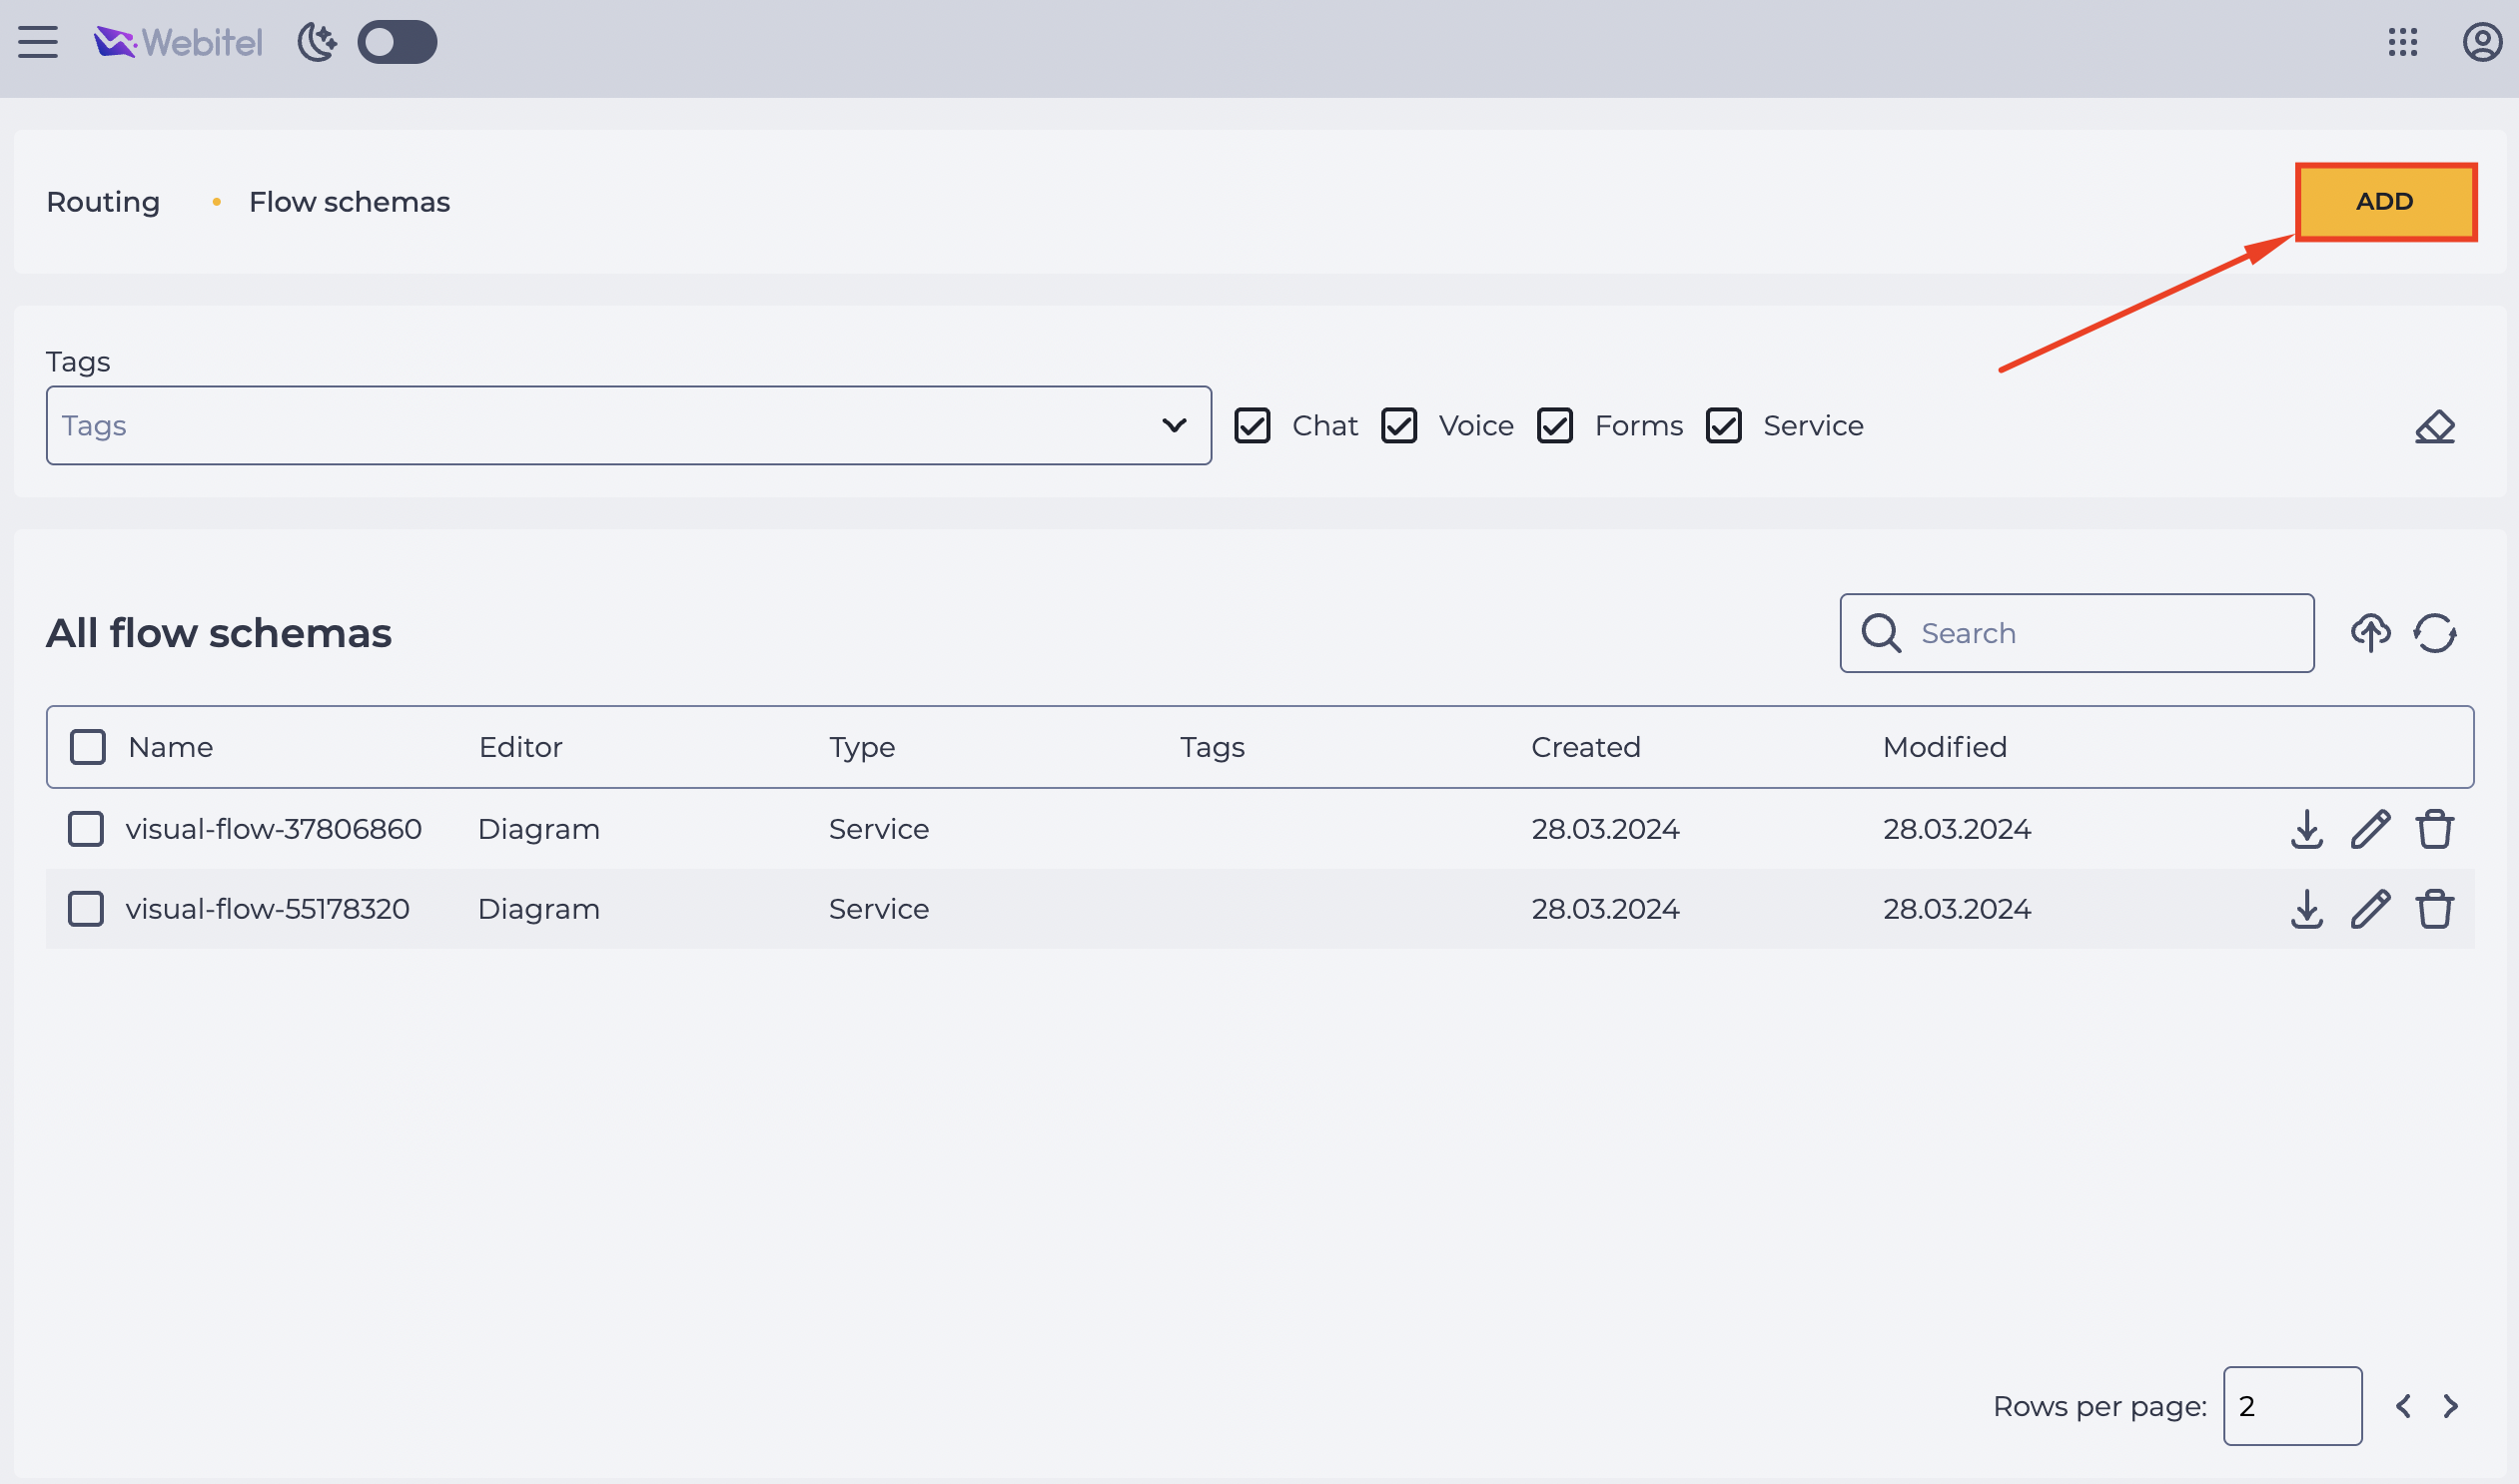
On the Flow schemas page, click the Add button (Fig. 23).
-
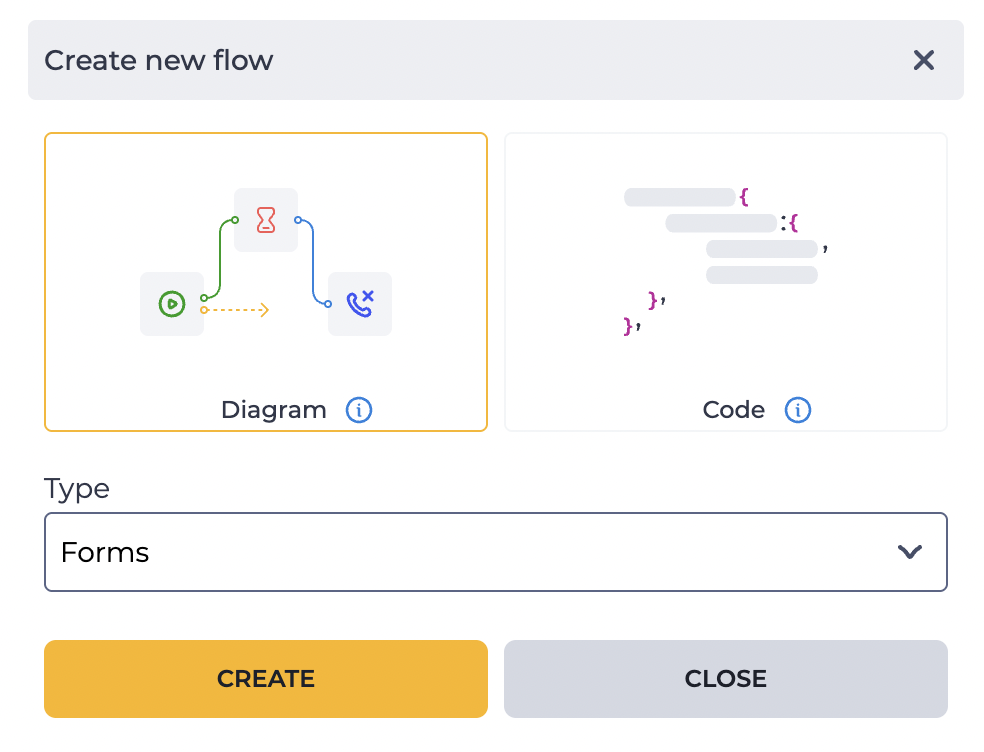
Create a scheme of the Forms type (Fig. 24).
-
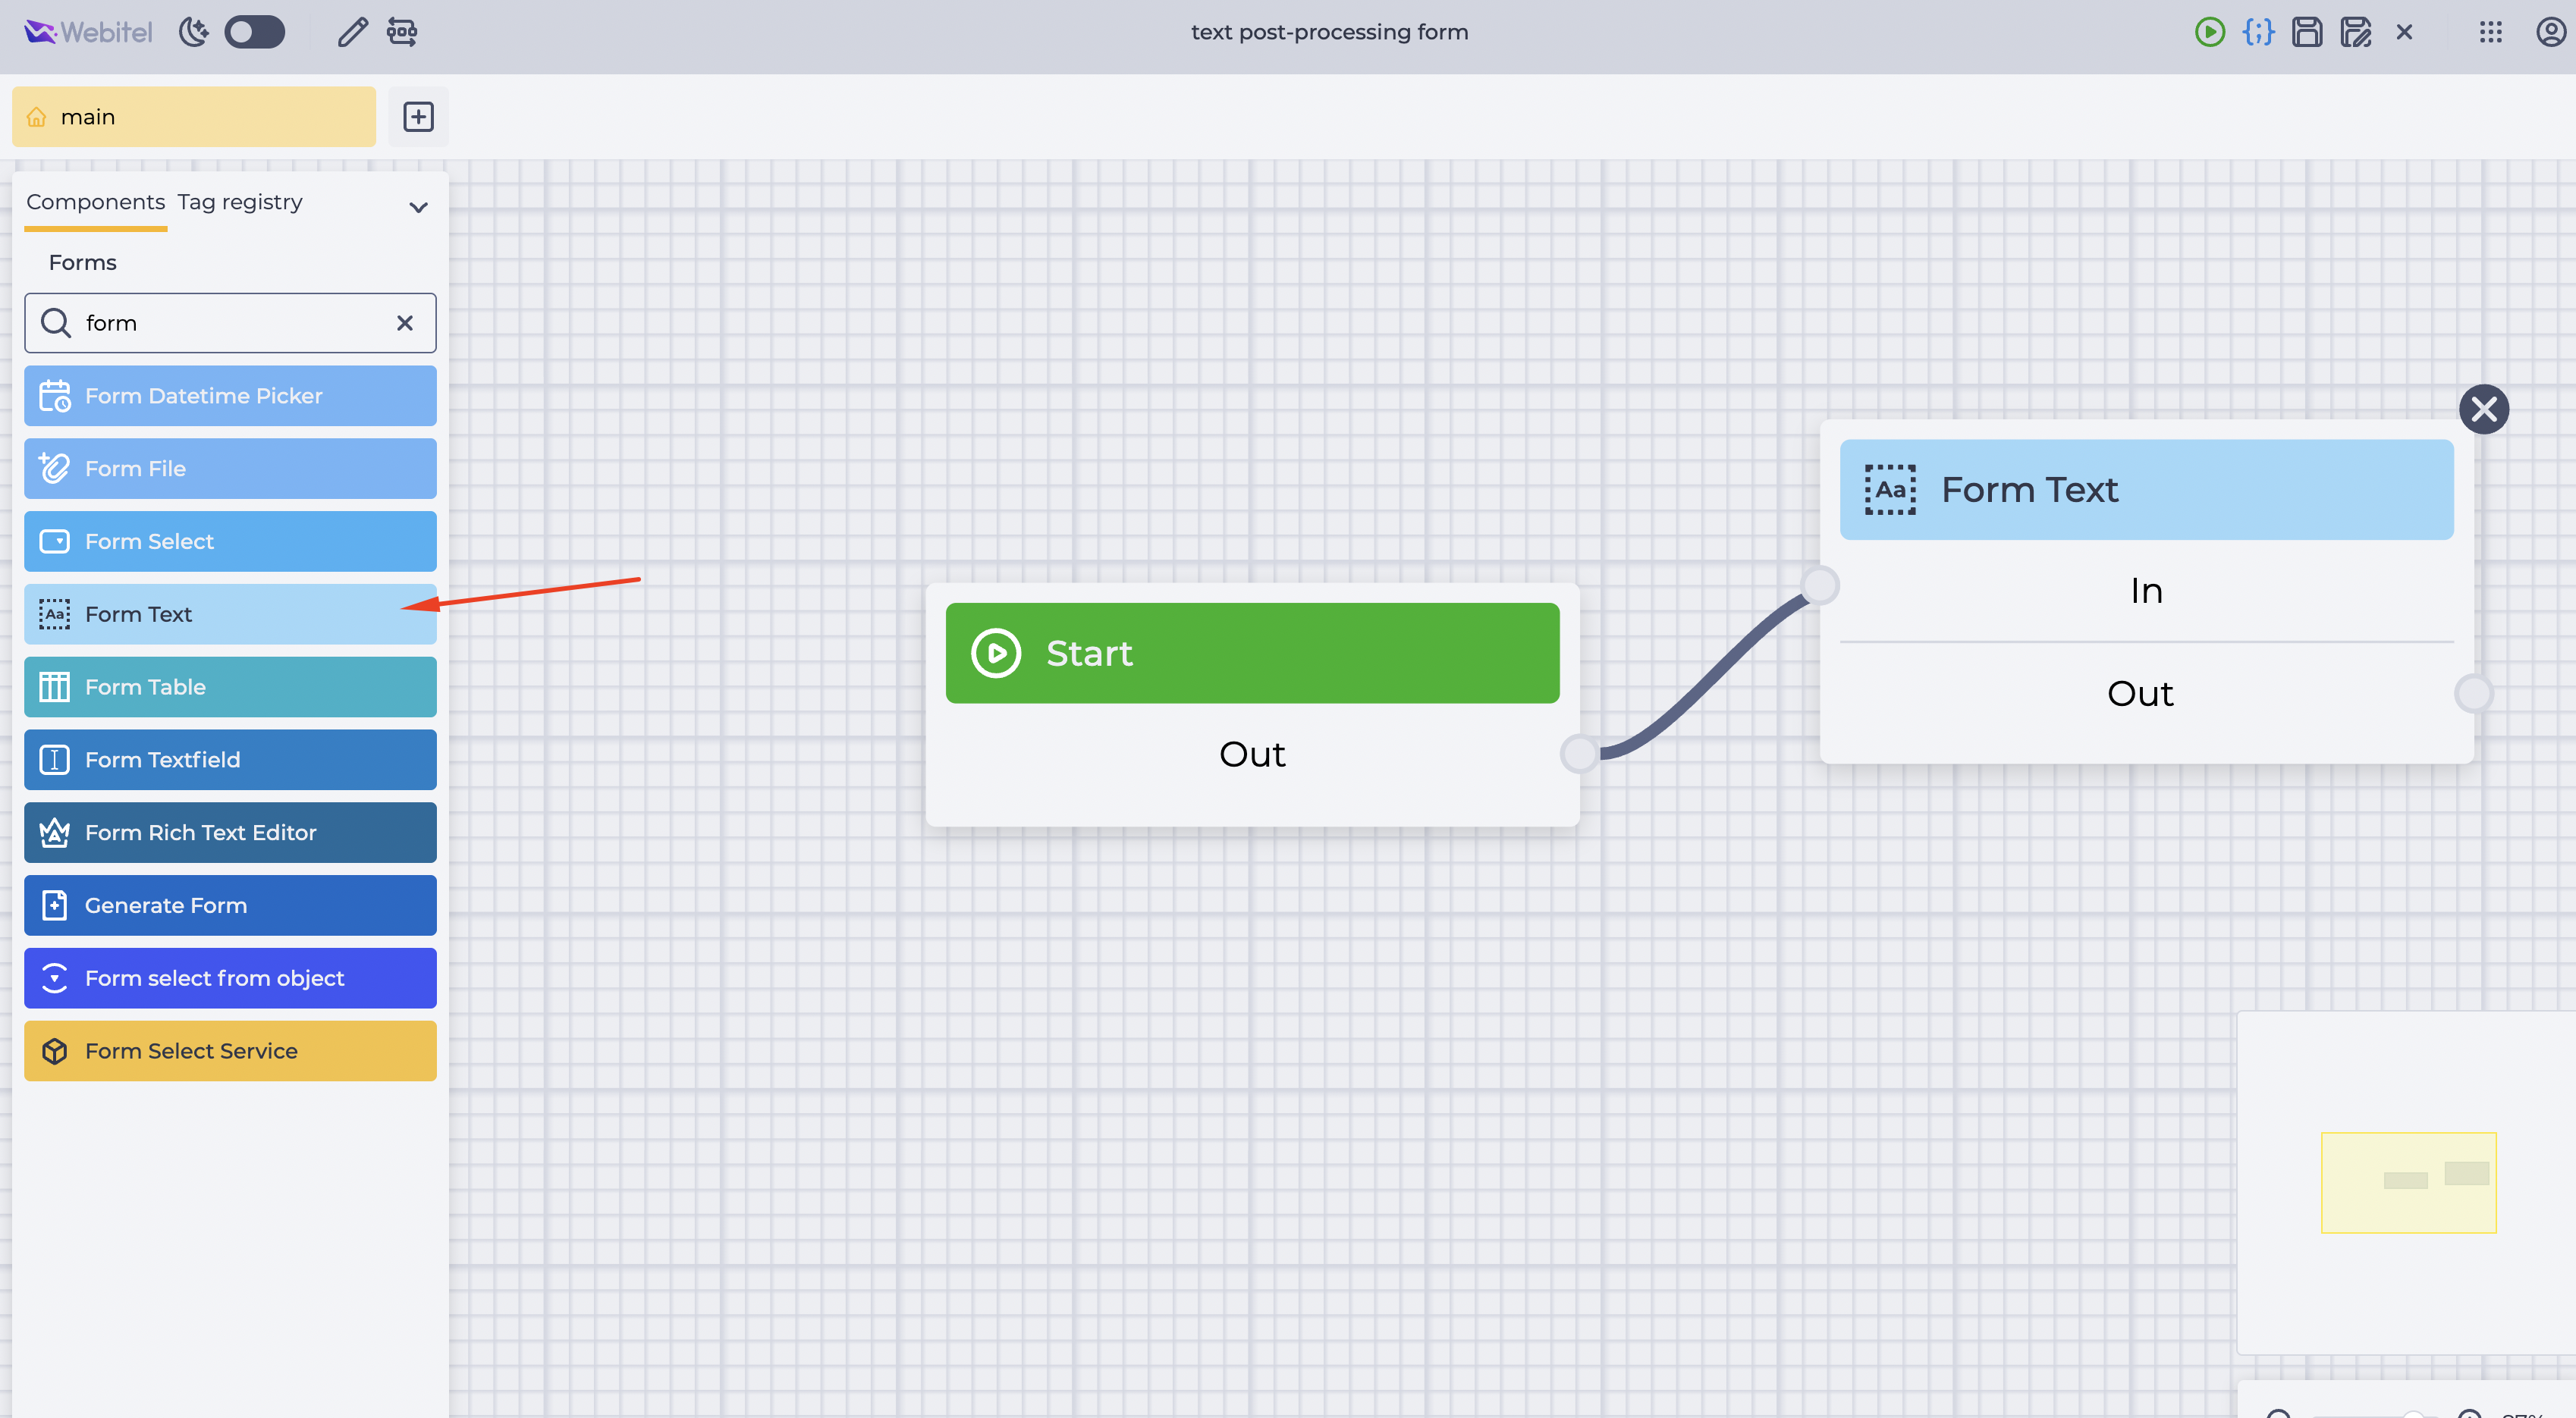
On the scheme configuration page, select the Form Text component (Fig. 25).
-
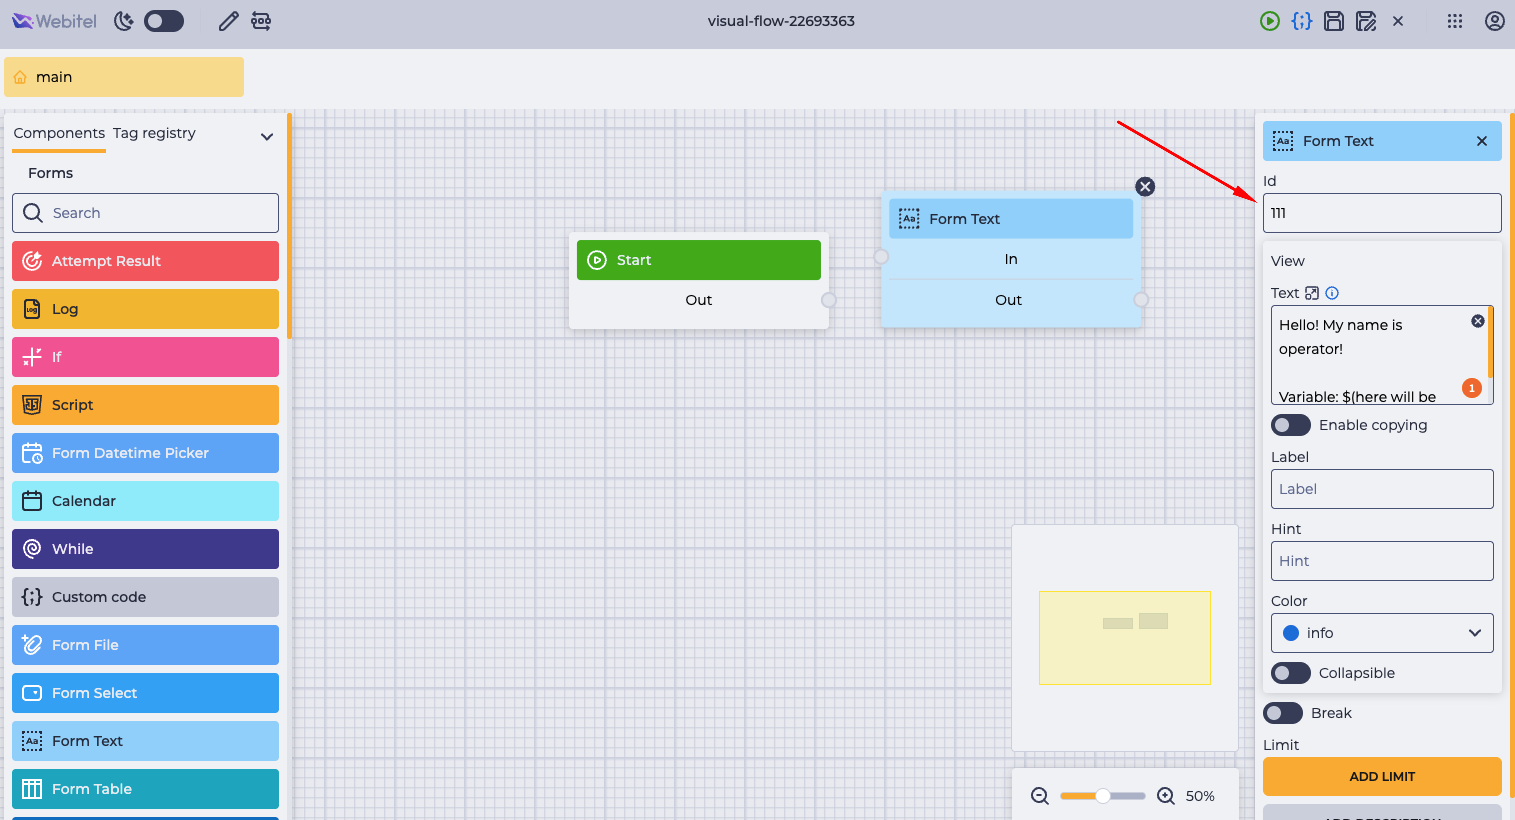
In the component settings, enter the name of the variable in the Id field (Fig. 26). You can copy the variable name from the Variables tab of the contact in the queue: Admin → Contact Center → Queues → Members → (Select a member) → Variables.
-
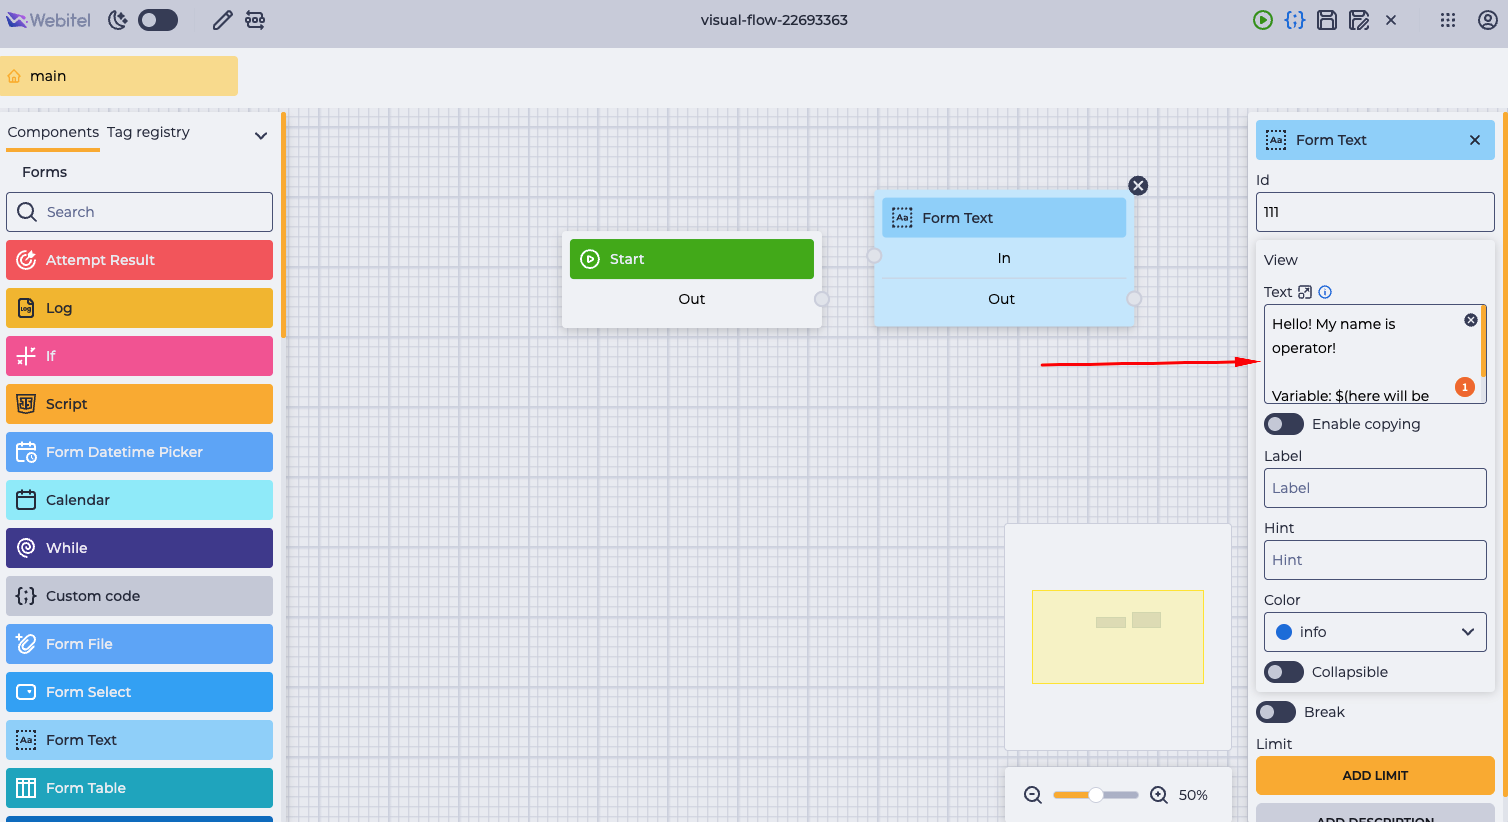
In the Text field, enter the message to be shown to the agent, including the variables in the
${variableName}format (Fig. 27).
-
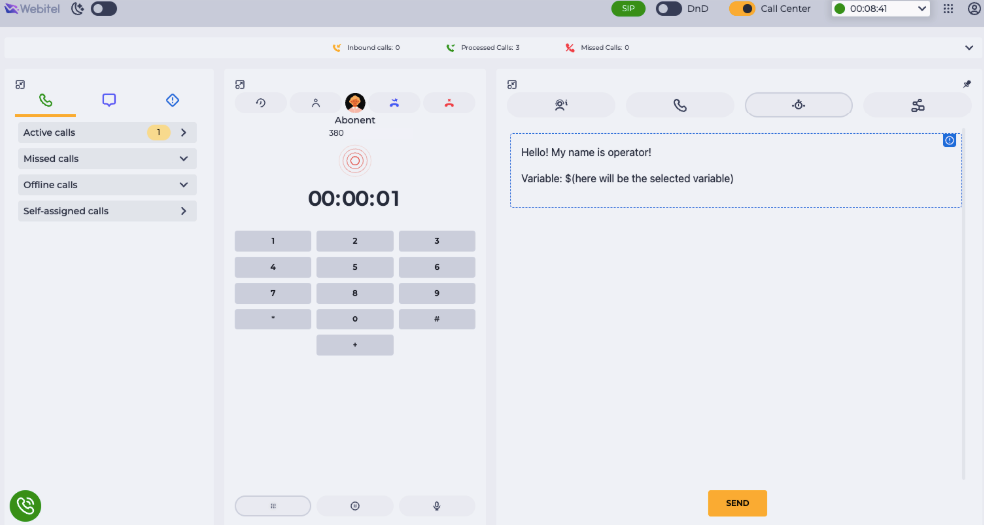
After saving and activating the scheme, the configured text and variable values will be automatically displayed in the Post-processing Form — without needing to click interface elements to expand the content. This simplifies the agent's workflow and speeds up access to important information (Fig. 28).
4. Analytics and Dashboards in Grafana: Monitoring Queues and Detecting Anomalies
Analytical dashboards in Grafana allow you to monitor the performance of queues, agents, and campaigns in real time, detect anomalies, and optimize the settings of the dialing system.
4.1. Accessing Dashboards
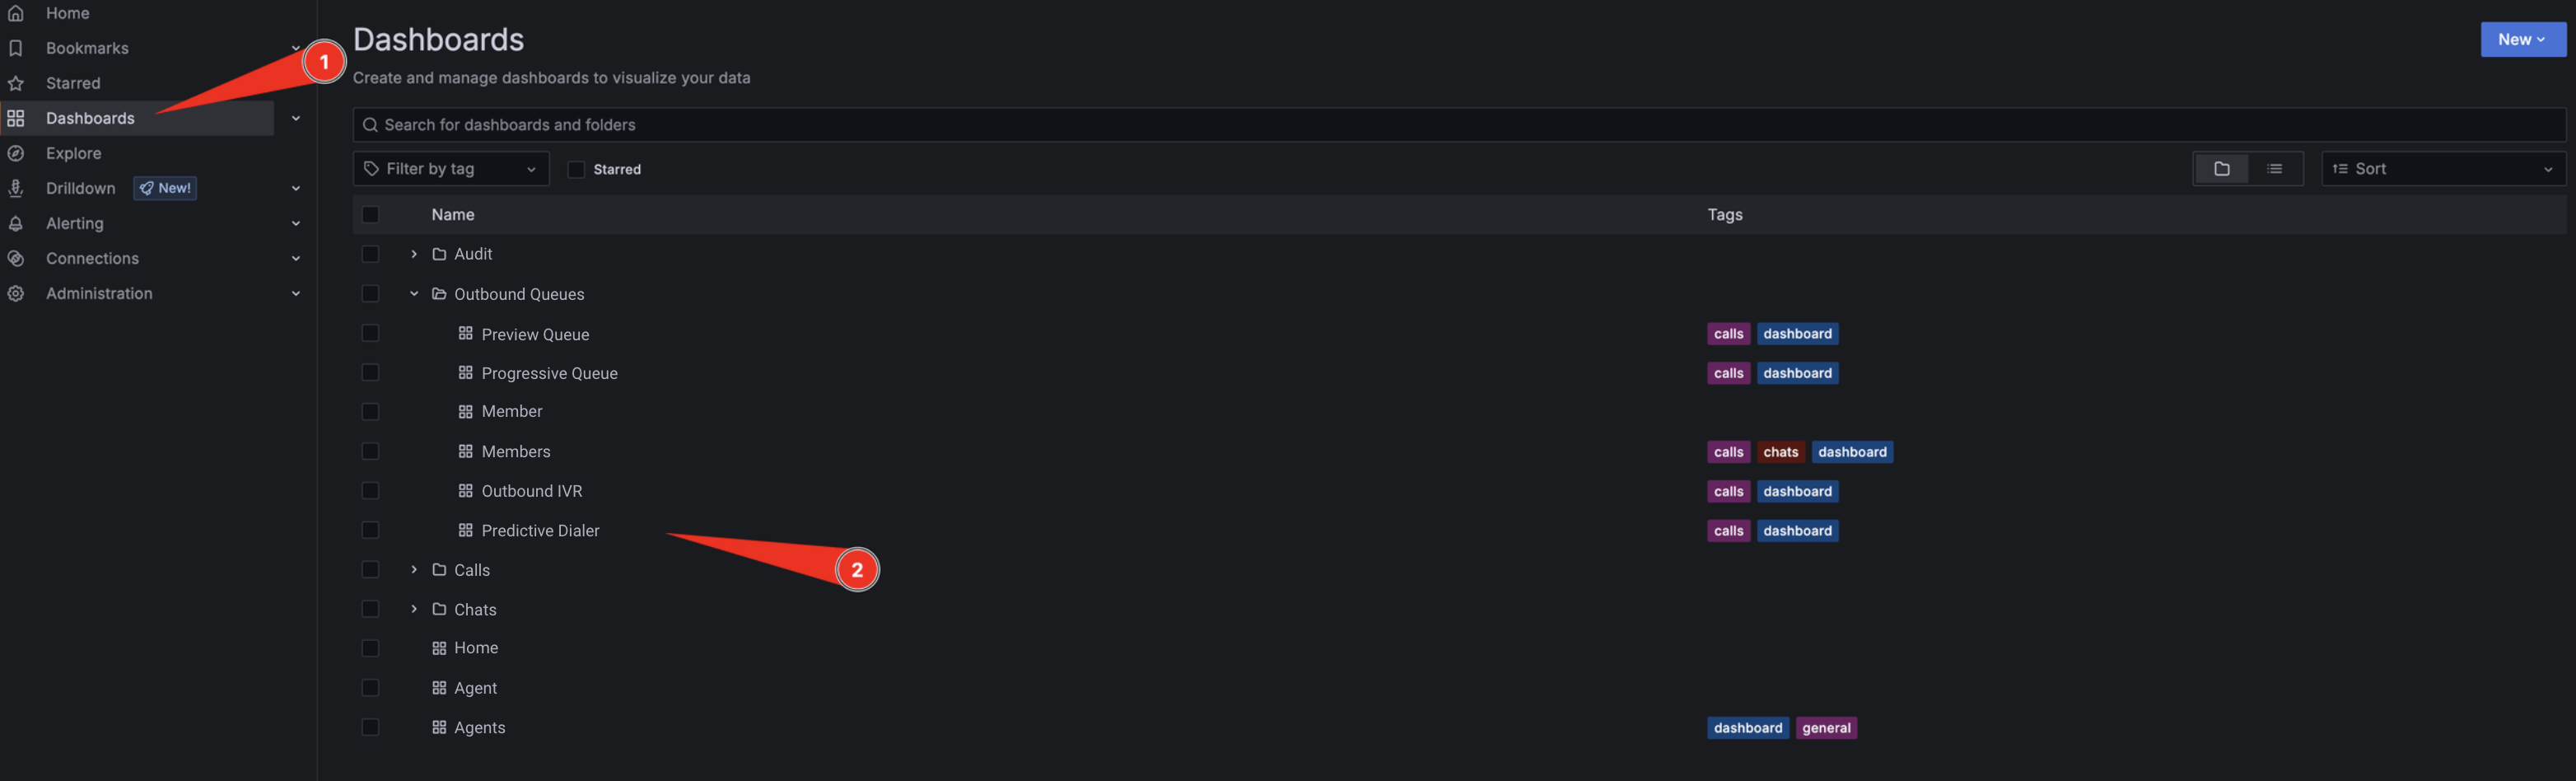
To access analytics, go to the Grafana system and select the Dashboards section from the left-hand menu (Fig. 29.(1)). From the list, select the desired dashboard (Fig. 29.(2)).
On each dashboard page, the following actions are available:
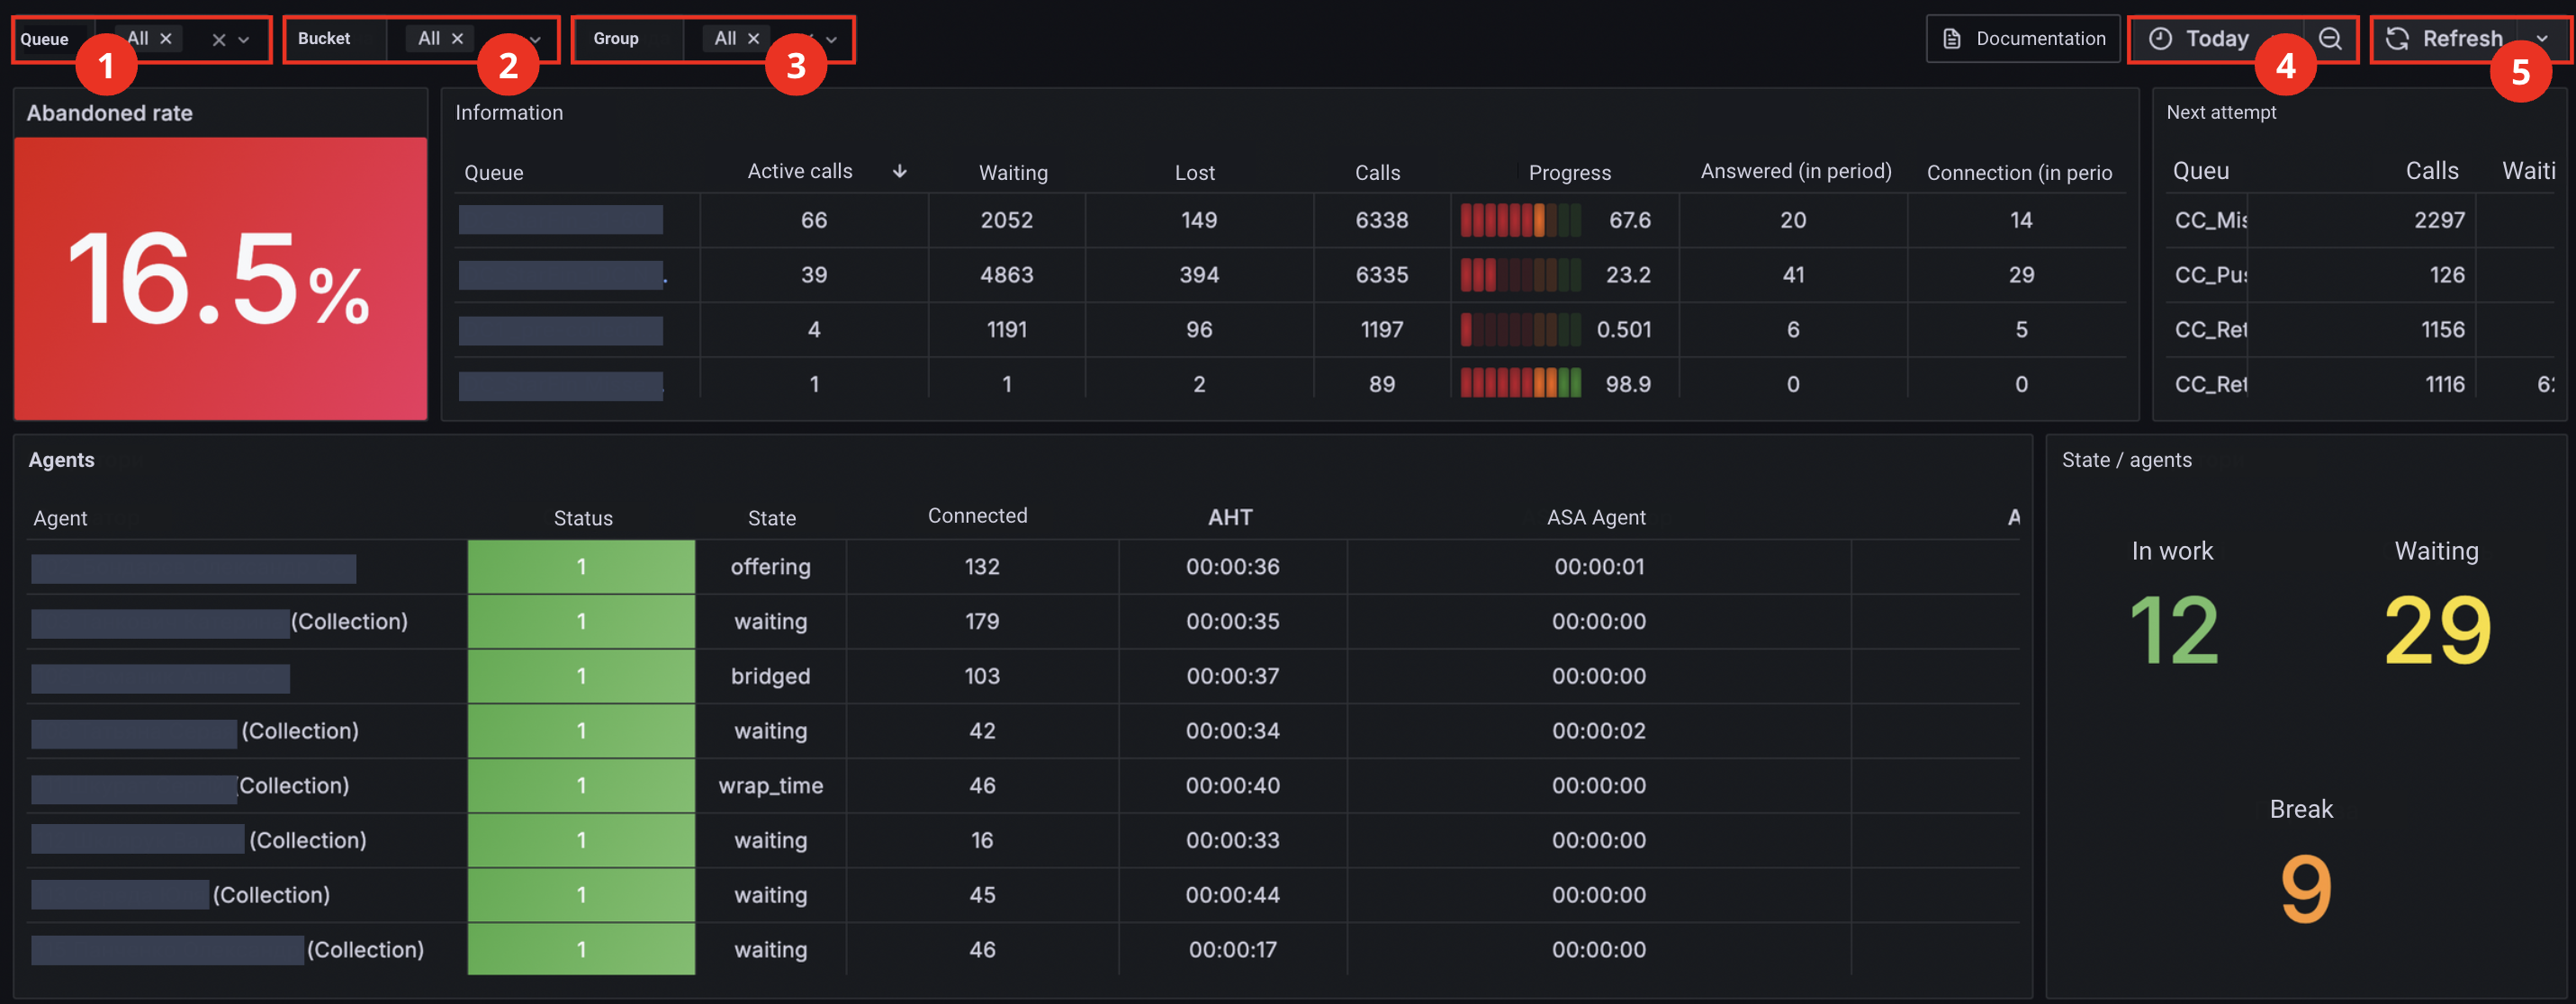
-
filtering by Queues (Fig. 30.(1)), Buckets (Fig. 30.(2)), and Teams (Fig. 30.(3));
-
selecting a time range (top right corner) (Fig. 30.(4));
-
enabling real-time data updates (Refresh) (Fig. 30.(5)).
4.2. Key metrics for Queue Analysis
The dashboard displays metrics that are critical to the operation of a contact center.
Values are highlighted in green or red depending on whether they meet the expected KPIs.
4.2.1. AR — Abandoned Rate
Displays the share of calls that were disconnected before reaching an agent.
There are two calculation methods depending on the context:
-
In the “Information” table → “AR (by queue interval)” (Fig. 31):

Formula:
Abandoned Rate (%) = (Ab - ARA) / An × 100
Where:
-
Ab — number of answered calls where the agent was not connected (only calls classified by AMD as HUMAN or NOTSURE, if allowed in queue settings).
-
ARA — Abandon Rate Adjustment, a dialer parameter that corrects the value.
-
An — number of answered calls with the same AMD classification.
This value is calculated for the interval defined in the queue settings (Recalculation interval parameter).
-
In other dashboards (outside the “Information” table):
A simplified formula is used without ARA adjustment:
Formula:
Abandoned Rate (%) = (Ab / An) × 100
This value is calculated based on the time range selected in Grafana dashboard filters.
4.2.2. “Information” Table
The “Information” table (Fig. 32) shows the number of members in queues and the progress of dialing.
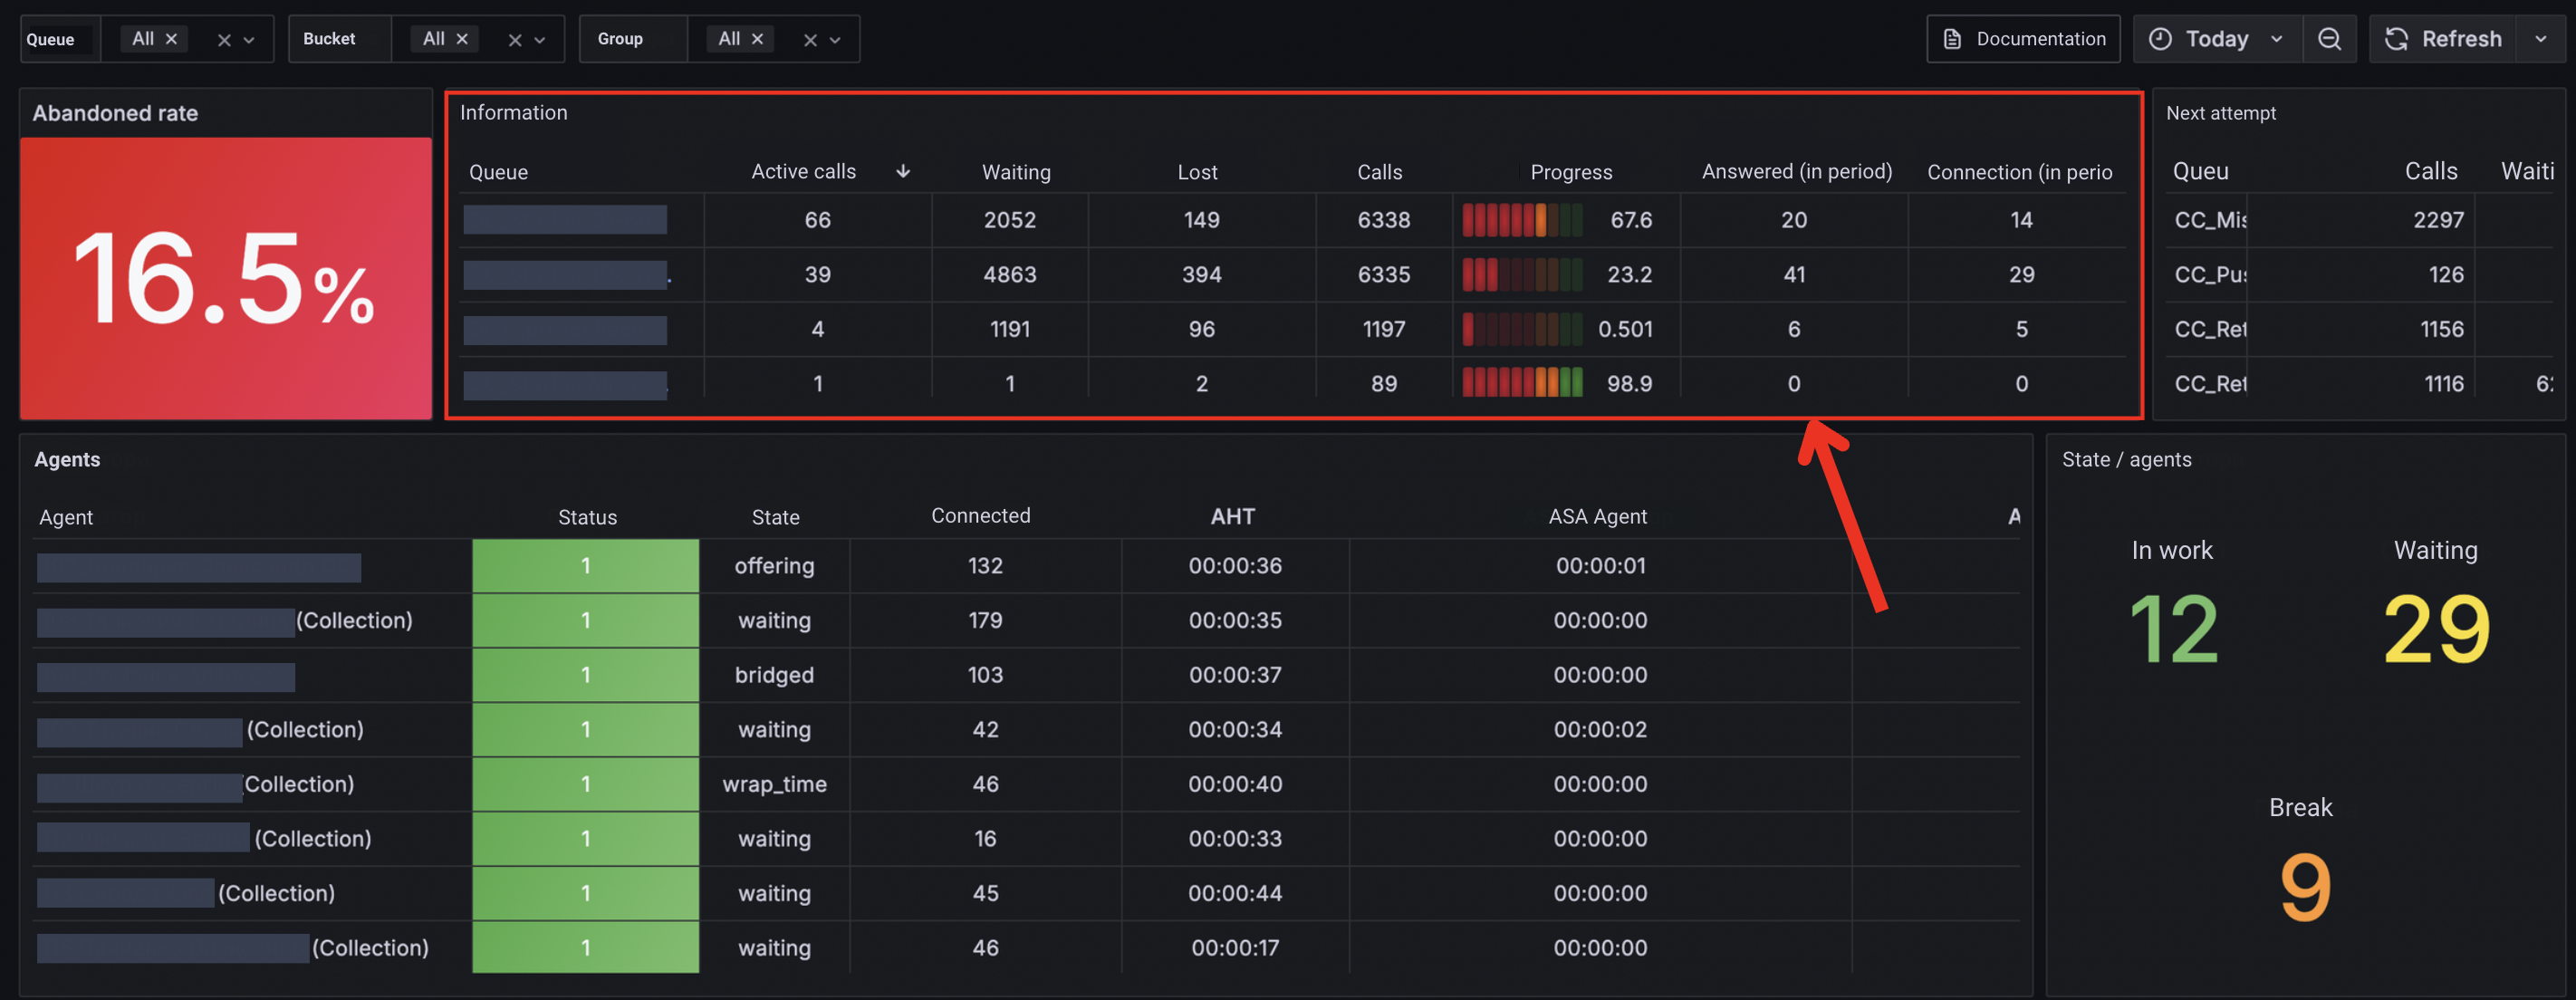
Below are the key indicators that directly affect the efficiency of the predictive dialer.
4.2.2.1. Progress
A visual scale showing the percentage of processed members relative to the total number in the queue:
-
from 0% to 60% - red color;
-
from 60% to 80% - orange color;
-
from 80% to 100% - green color.
4.2.2.2. Answered (by dialer interval)
Displays the total number of calls answered by agents during the dialer’s recalculation interval. Each dialer type has its own Recalculation interval parameter.
4.2.2.3. Connected (by dialer interval)
Total number of calls successfully connected to agents during the recalculation interval.
4.2.2.4. Lost (by dialer interval)
Number of calls where the member answered, but no agent was connected.
4.2.2.5. Average Response Time
The average time it took for an agent to answer a call.
4.2.2.6. Dialing (predicted)
Estimated time required to handle a call.
May include:
-
time to connect with an agent;
-
time for the member to describe their issue;
-
time for the agent to provide a response.
Calculation is performed according to the internal logic of the dialer.
4.2.3. Agents Table
The “Agents” table (Fig. 33) displays general call information for each operator.
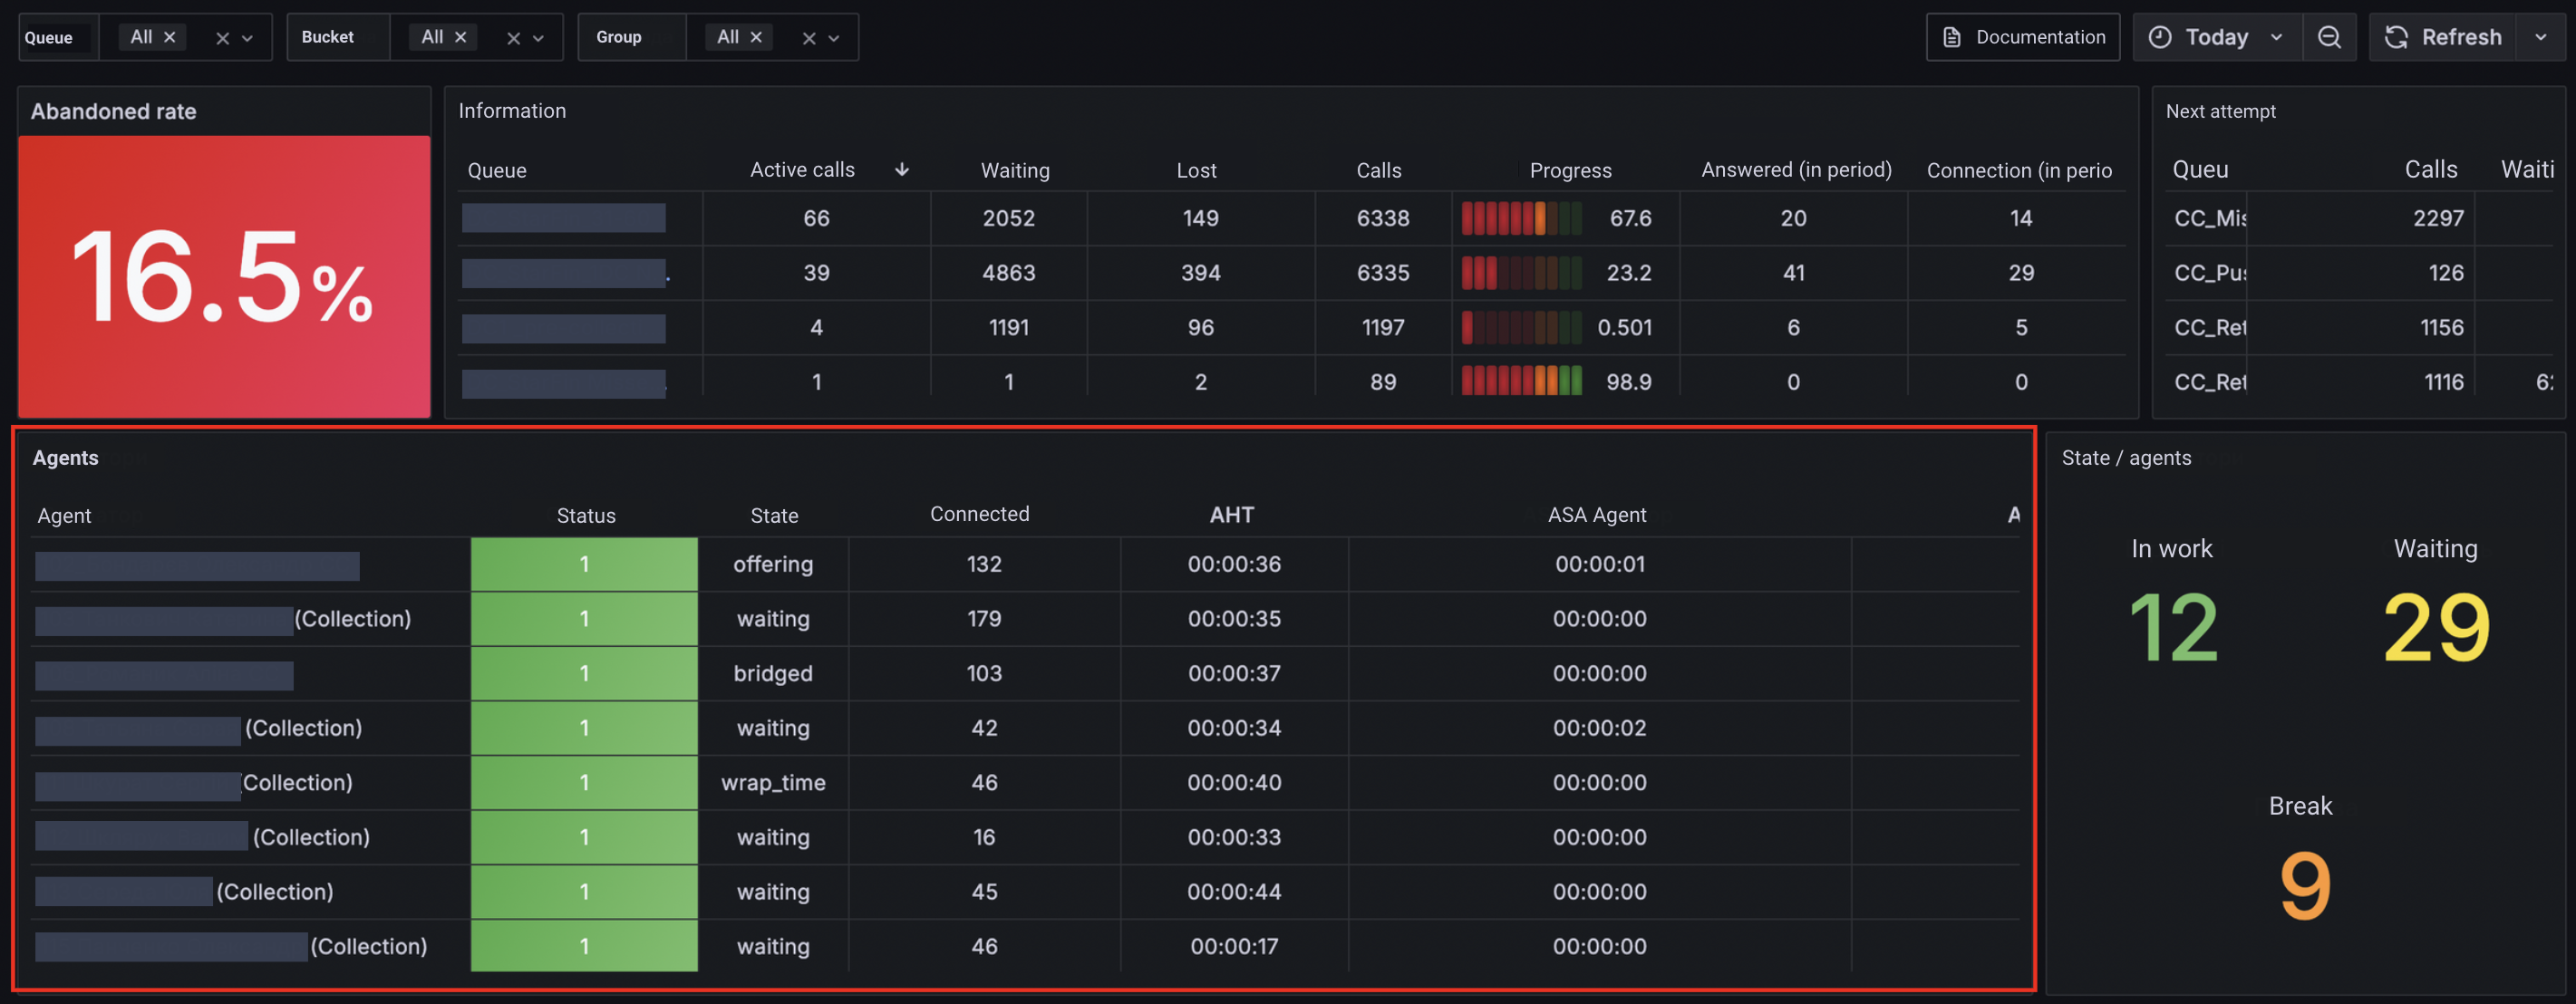
4.2.3.1. AHT (Average Handle Time)
The average amount of time an agent spends handling a call — from the moment the call is answered until the post-processing phase or call termination.
Formula:
AHT = (talk time + post-processing time) / number of connected calls
4.2.3.2. ASA (Average Speed of Answer)
The total time callers spend waiting in the queue, divided by the number of calls answered by agents during the selected period.
-
Agent ASA — the average time it takes an agent to answer a call (from call start to answer).
-
Member ASA — the average time it takes a member to answer a call (from call start to answer).
Formula:
ASA = total wait time of answered calls (sec) / number of answered members (per day)
4.3. How Lost% (Abandoned Rate) Depends on Queue Settings
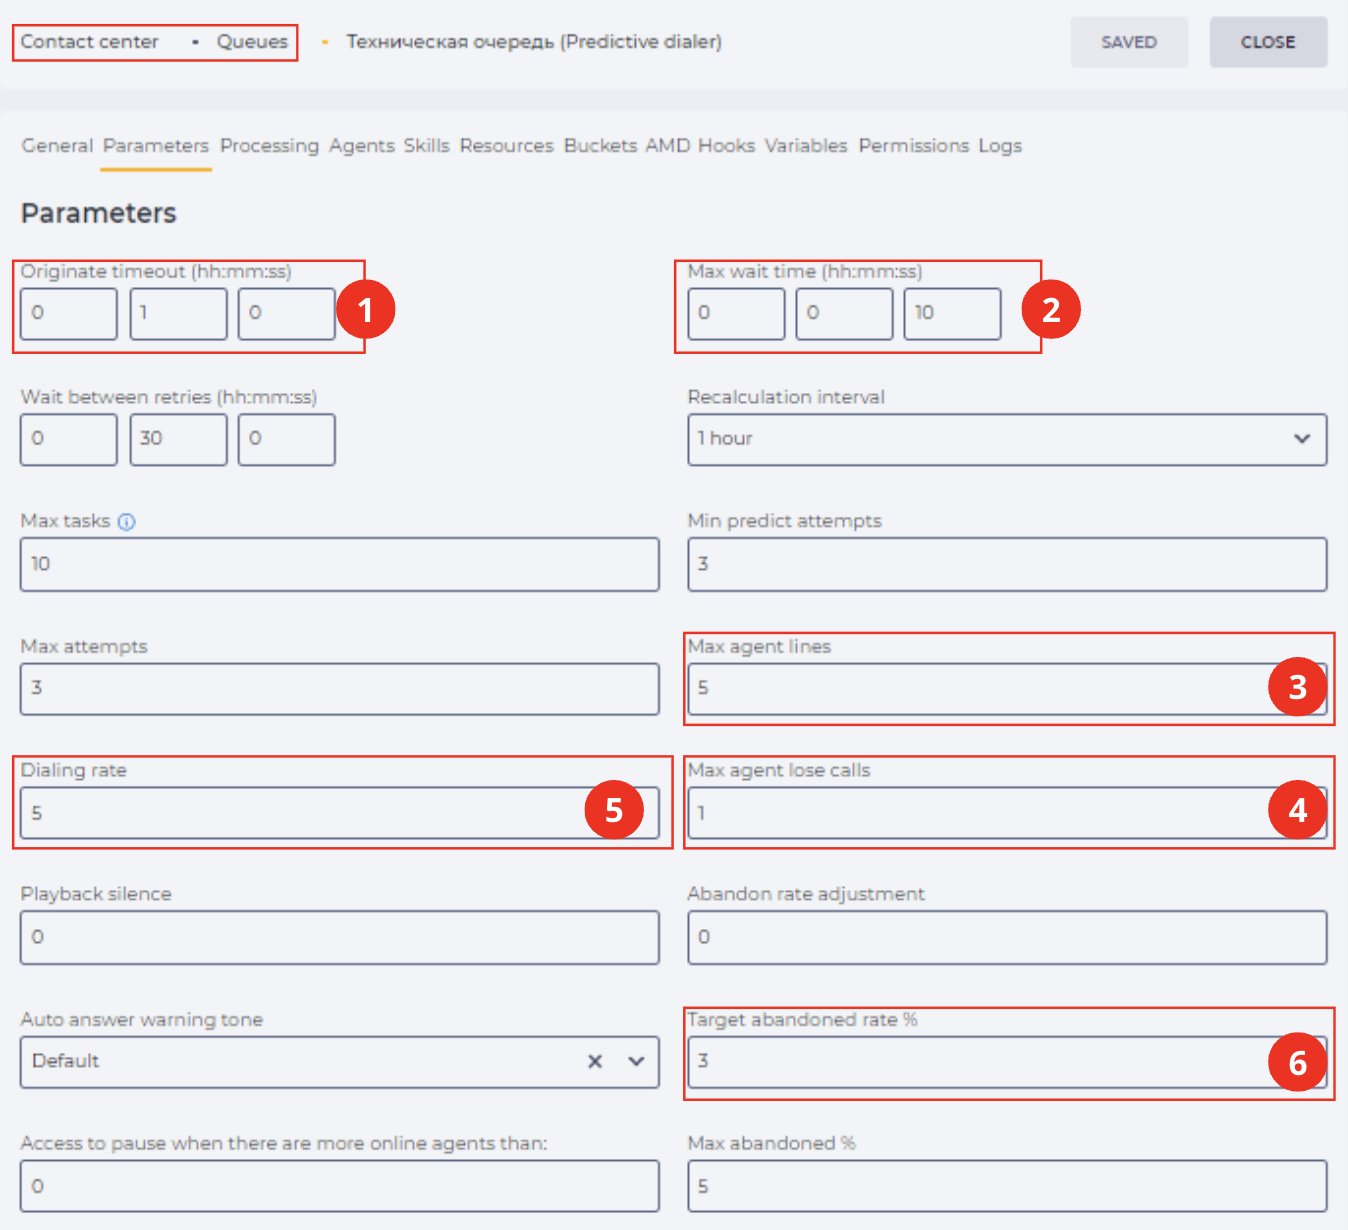
The Lost% (Abandoned Rate) metric is directly influenced by the queue configuration in Webitel (Admin → Contact Center → Queues → [Selected Queue] → Parameters tab).
The following parameters have a major impact on this metric:
-
Originate timeout and Max wait time (Fig. 34.(1,2)) — define how long a member will wait before abandoning the call.
-
Max agent lines (Fig. 34.(3)) — the higher this value, the greater the risk of agent overload.
-
Max agent lose calls (Fig. 34.(4)) — determines the threshold of missed calls that will stop further dialing.
-
Dialing rate (Fig. 34.(5)) — a high value may result in agent overload.
-
Target abandoned rate % (Fig. 34.(6)) — the KPI threshold for the Lost% metric.
4.4. Detecting Anomalies in Dashboards
Below are the key anomalies to monitor in order to ensure stable system operation and efficient call handling:
-
AR (by queue period) in the Information table (Fig. 35) — this value should not exceed the threshold configured in the dialer and should remain lower than the overall Abandoned Rate, which reflects the total percentage of lost calls. A high value may indicate queue configuration issues or insufficient number of available agents.
-
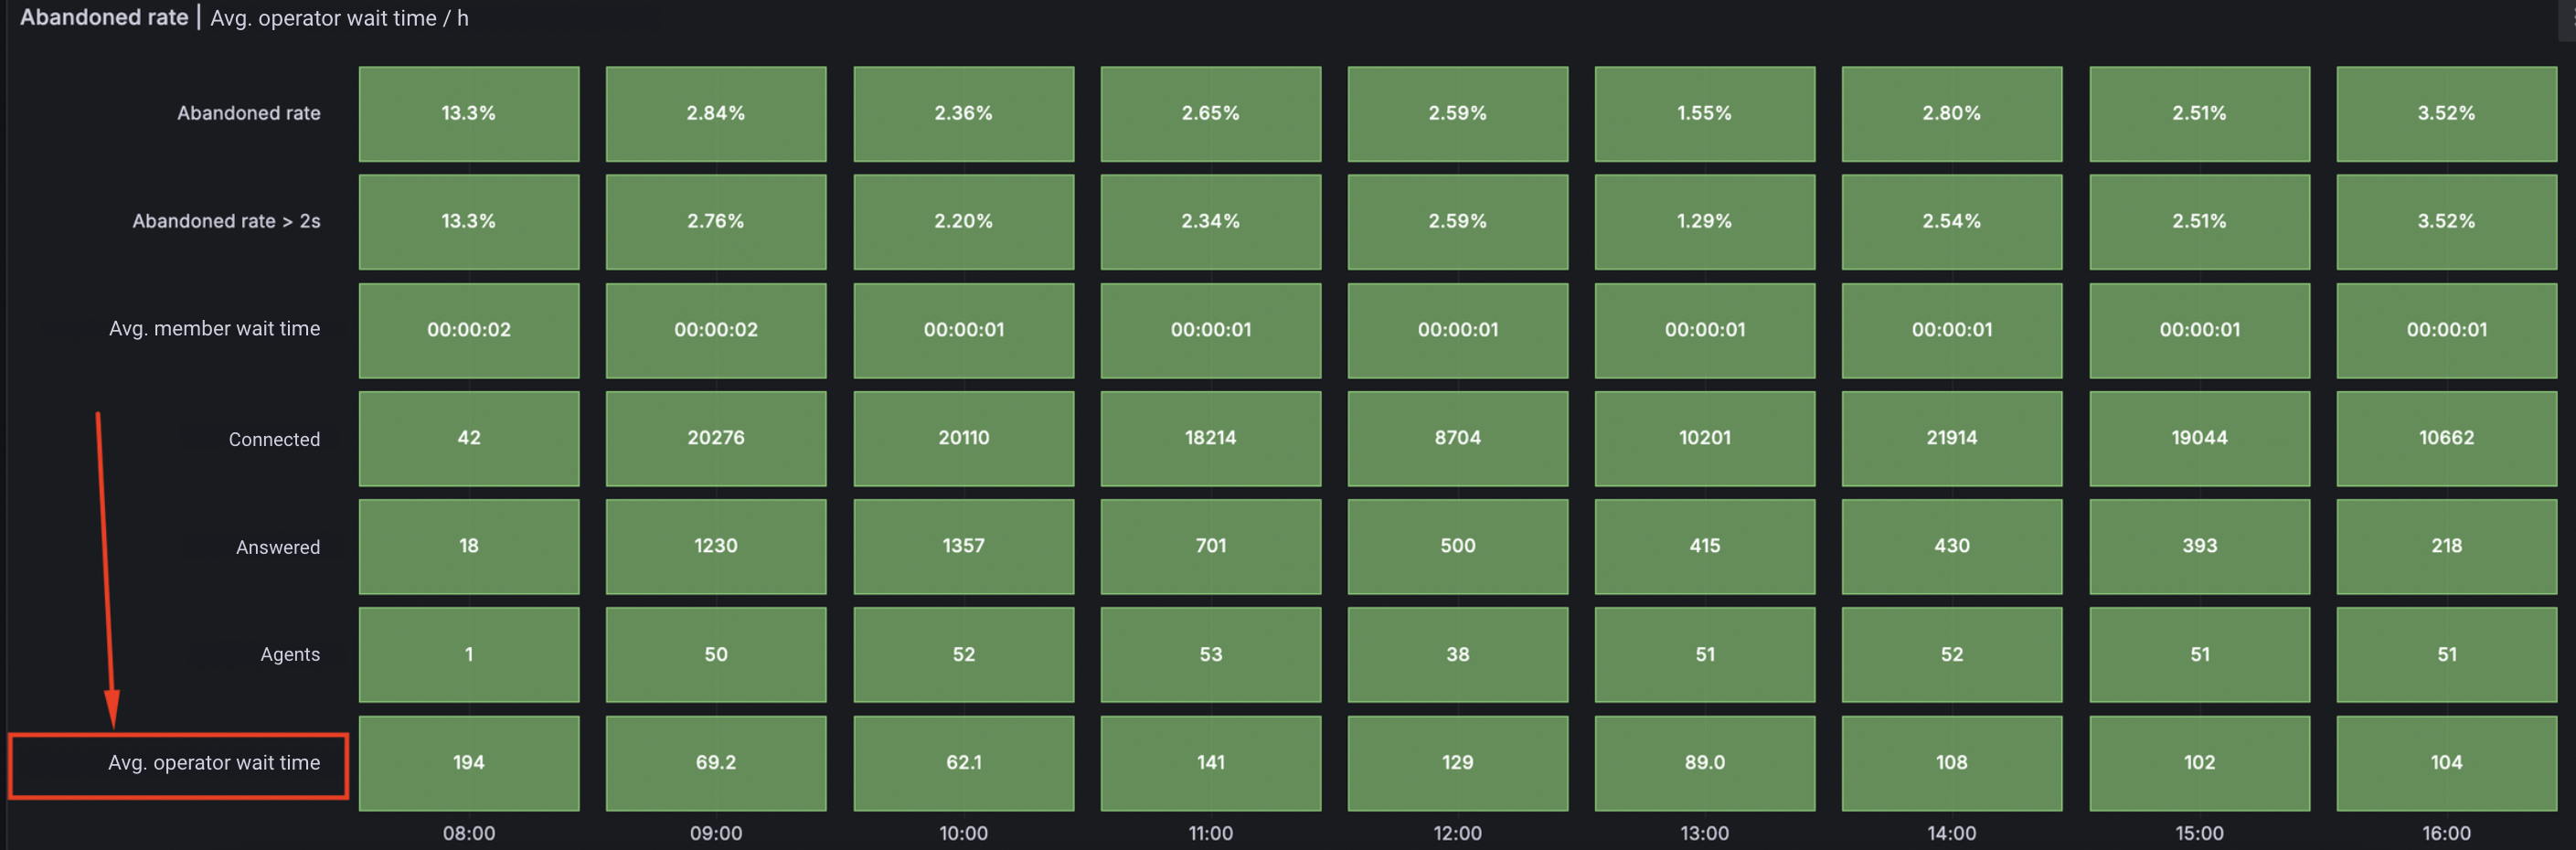
Avg. operator wait time (Fig. 36) — shows how long an operator waits before receiving a call. If this value is high, consider increasing the dialing load.
-
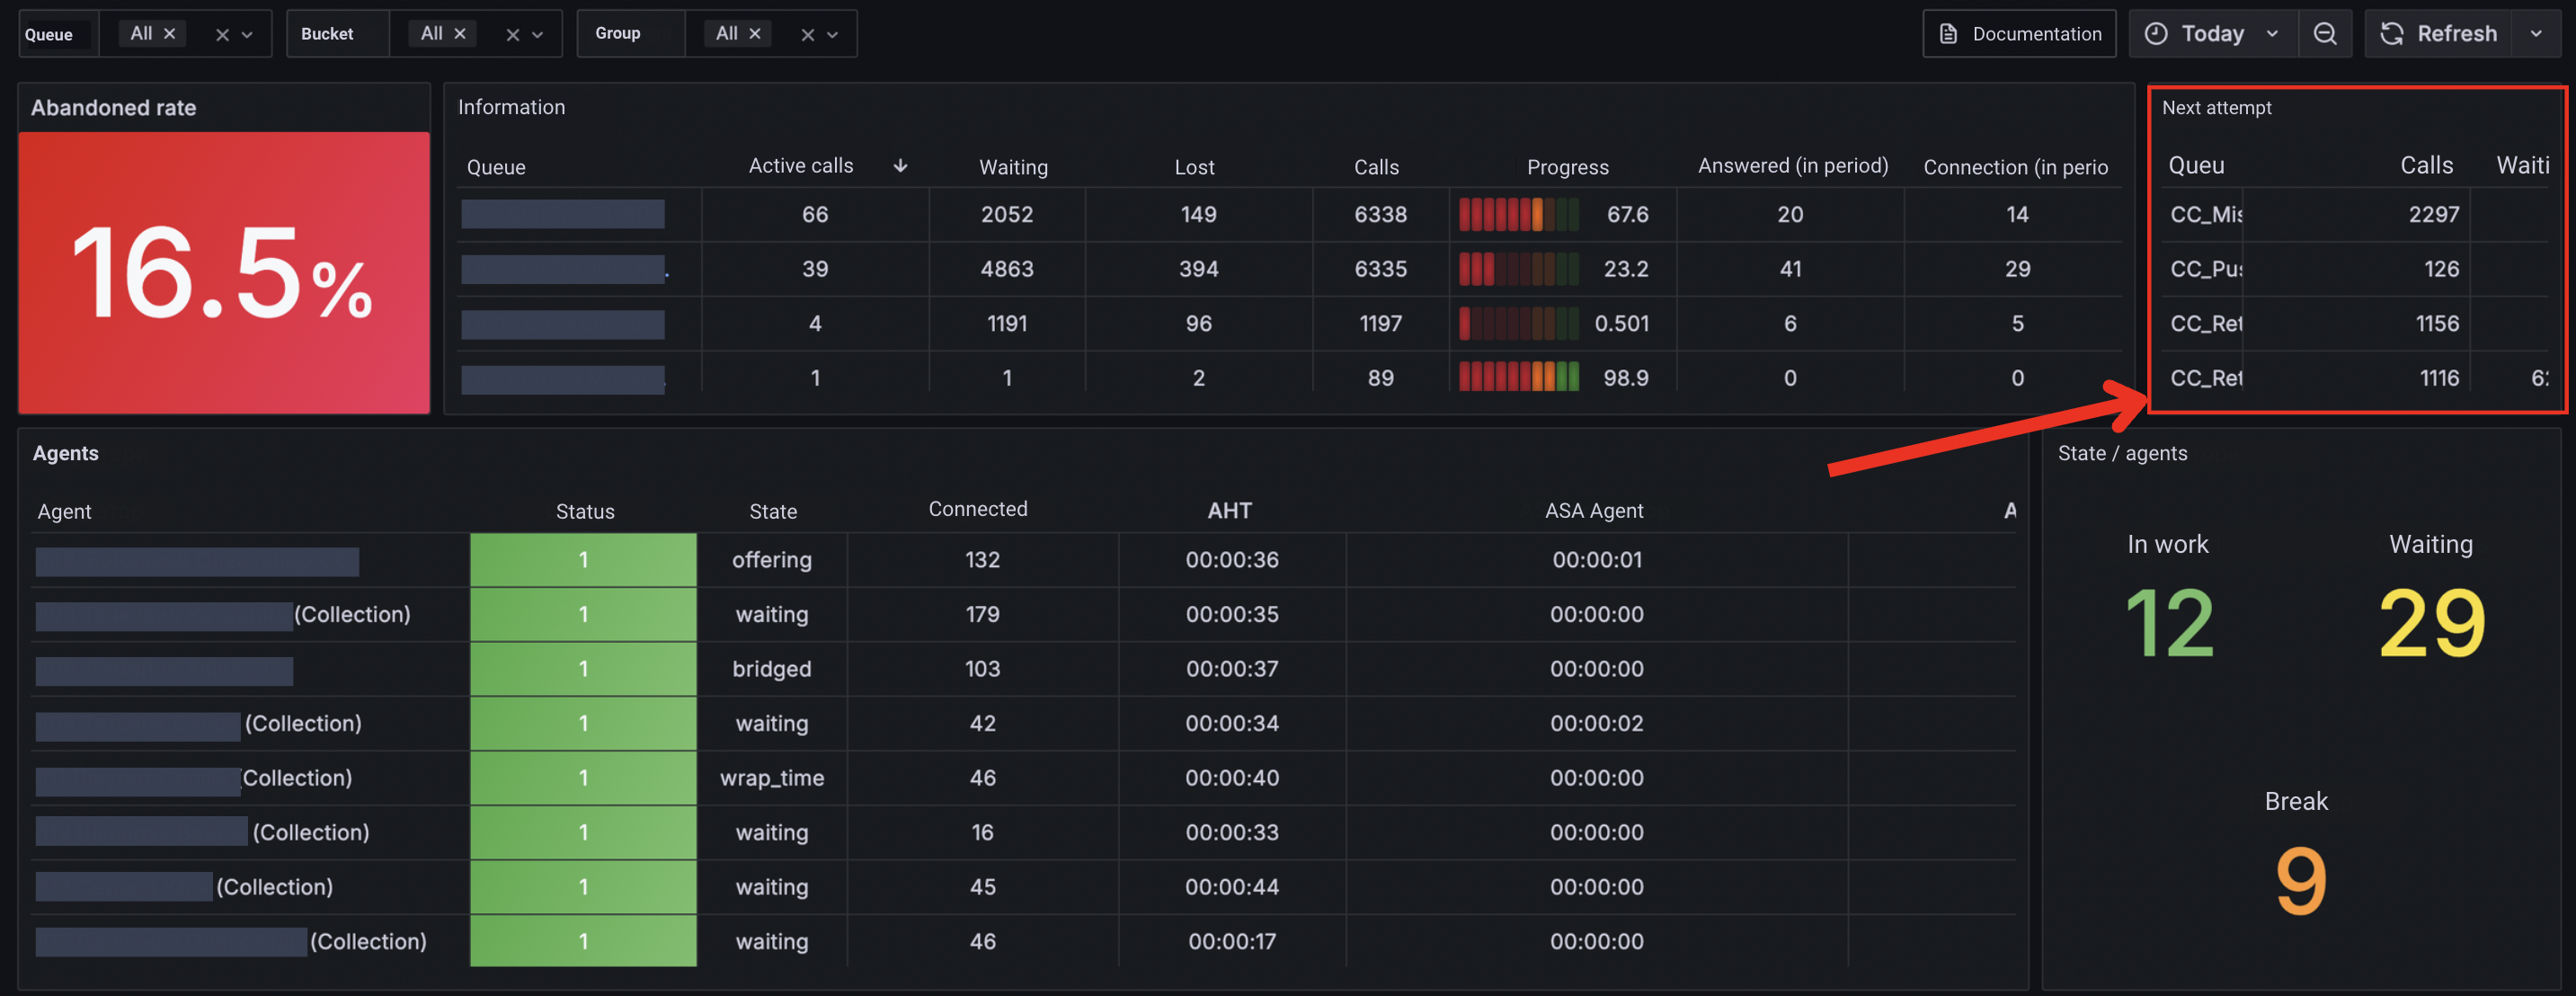
Next Attempt table (Fig. 37) — helps identify why a queue is making too few dialing attempts or not dialing at all. It also shows how many members are being taken into processing. If no members are listed — the queue is inactive. If the number is low — the queue may not be using all available resources, which may cause agent idle time.
-
Resources table (Fig. 38) — if the channel limit is used at 100% while agents are idle, consider increasing the number of lines available to the dialer.

-
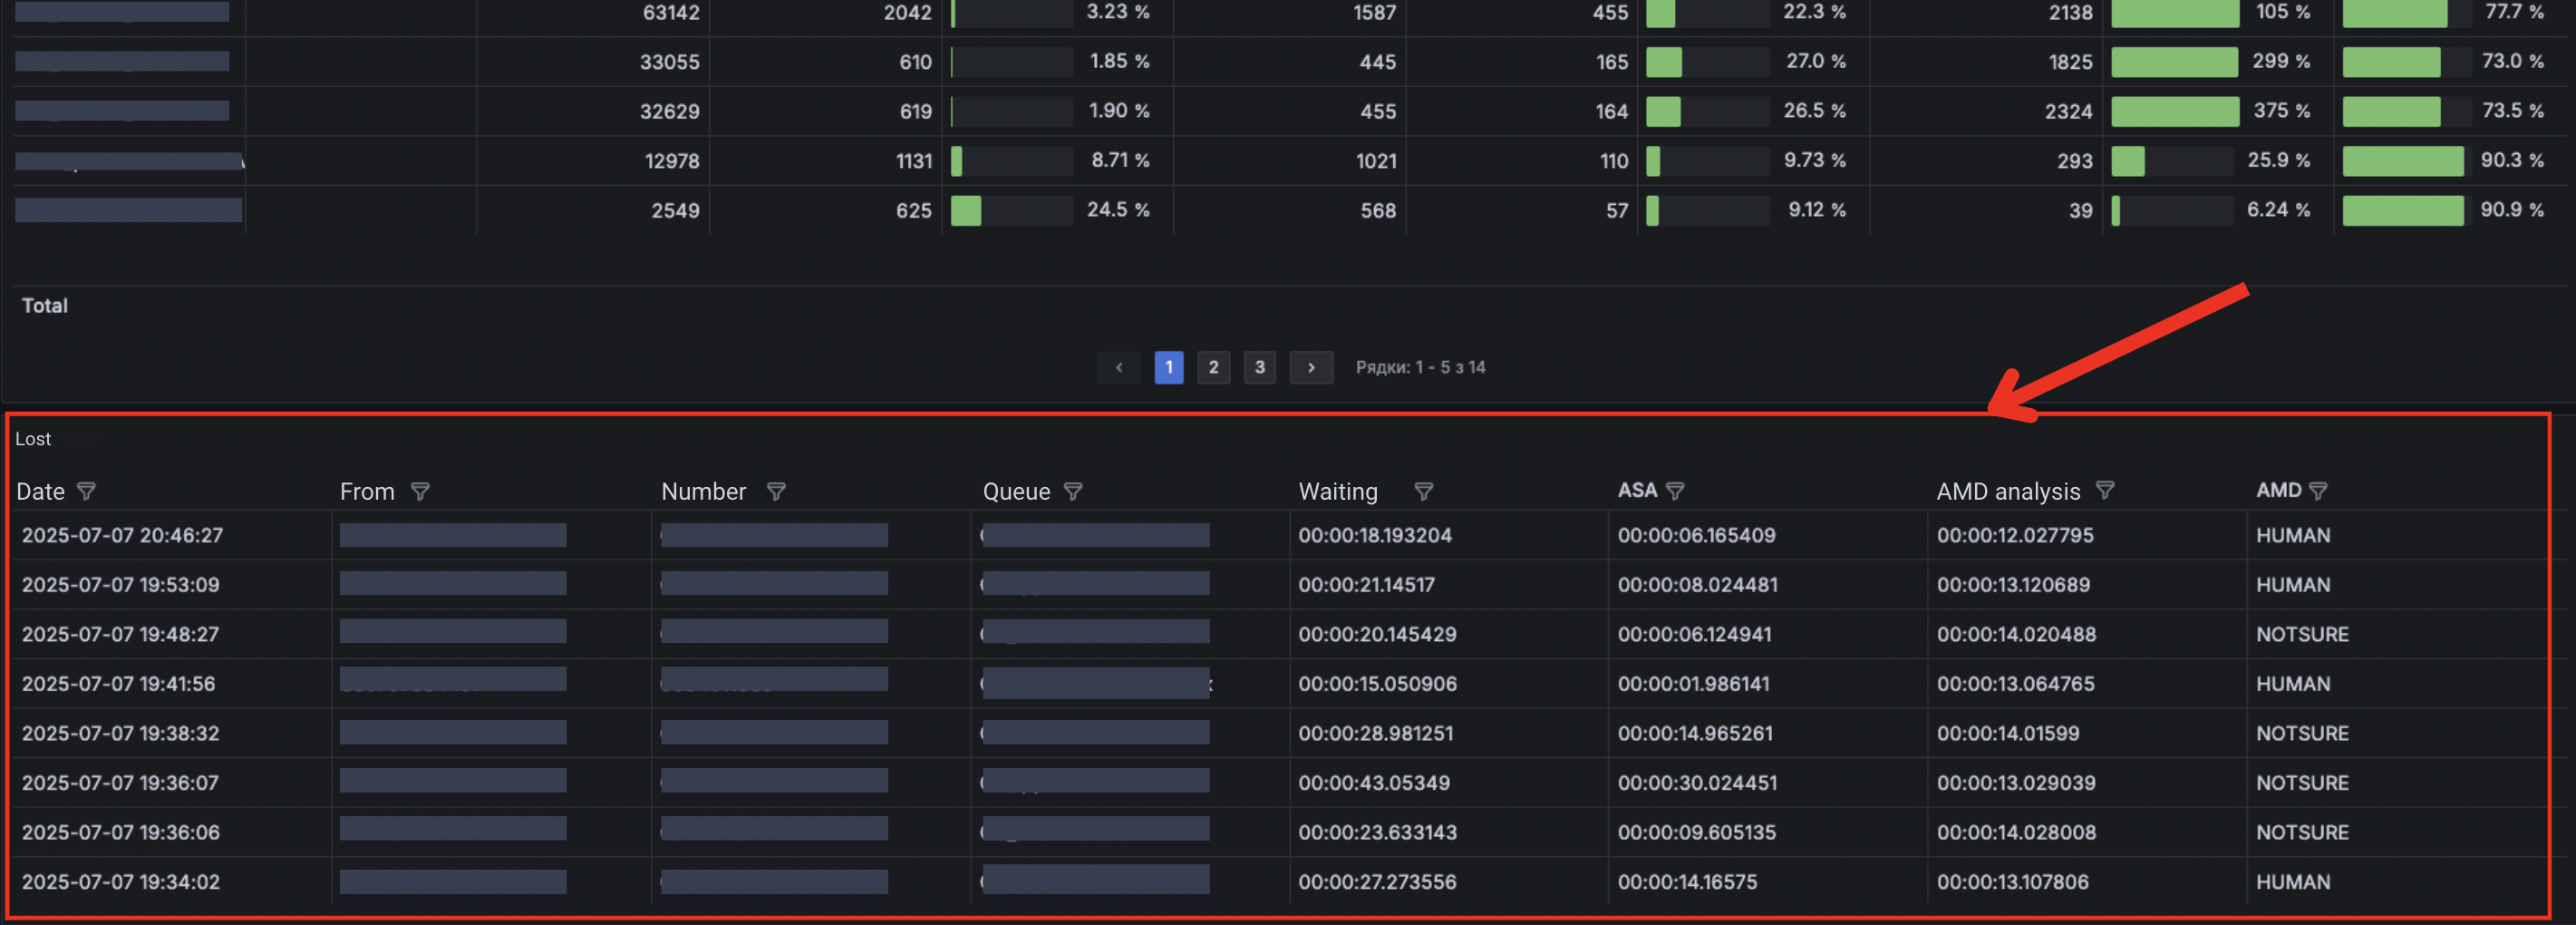
Lost table (Fig. 39) — if the number of lost calls increases, review the AMD settings or analyze reasons for extended member waiting times before an agent answers.
Note on Grafana: Automatic anomaly highlighting in Grafana dashboards may be unavailable due to custom thresholds used in different projects. Manual configuration is required, taking into account each system’s specific setup.